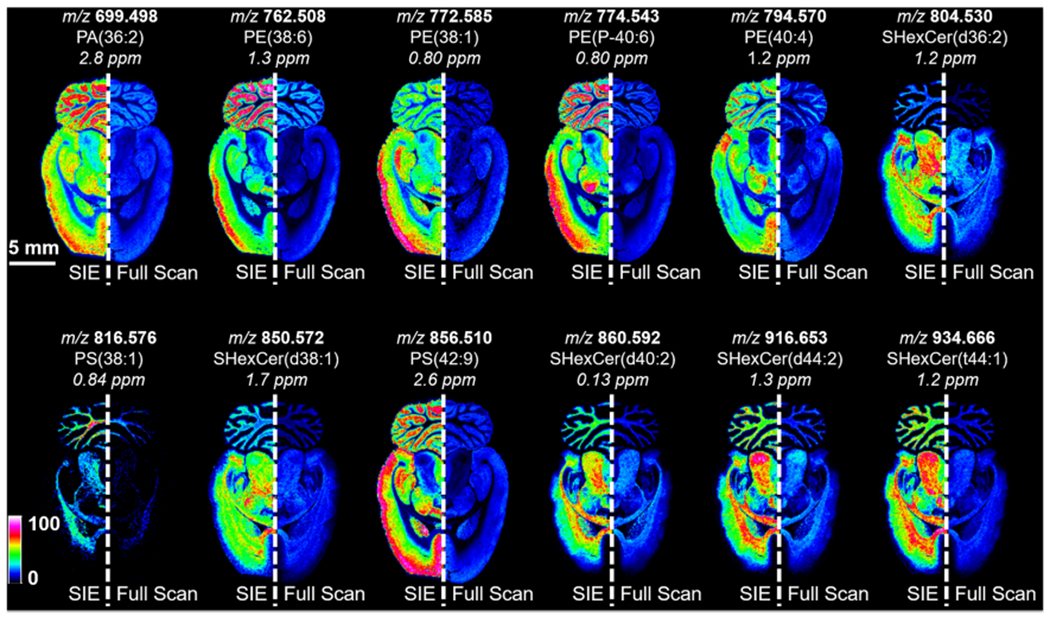
Figure 7.

Imaging mass spectrometry analysis of a rat brain using (right hemisphere) full-scan acquisition mode and (left hemisphere) using a 2.5 V, 123.5 kHz SIE waveform with an LMCO of 450 Da. The number of laser shots was varied between the two methods to maximize the intensity of the ion populations without reaching the space charge limit (full scan: 55 laser shots, SIE: 225 laser shots). Both experiments were performed using an 80 μm random walk. Ion images for a range of lipids show improved brightness (i.e., sensitivity) and contrast (i.e., dynamic range) using the SIE acquisition method. Images are shown without normalization.
