
Figure 2. Dynamics and distribution of PtdIns4P during initiation of phagosome resolution.
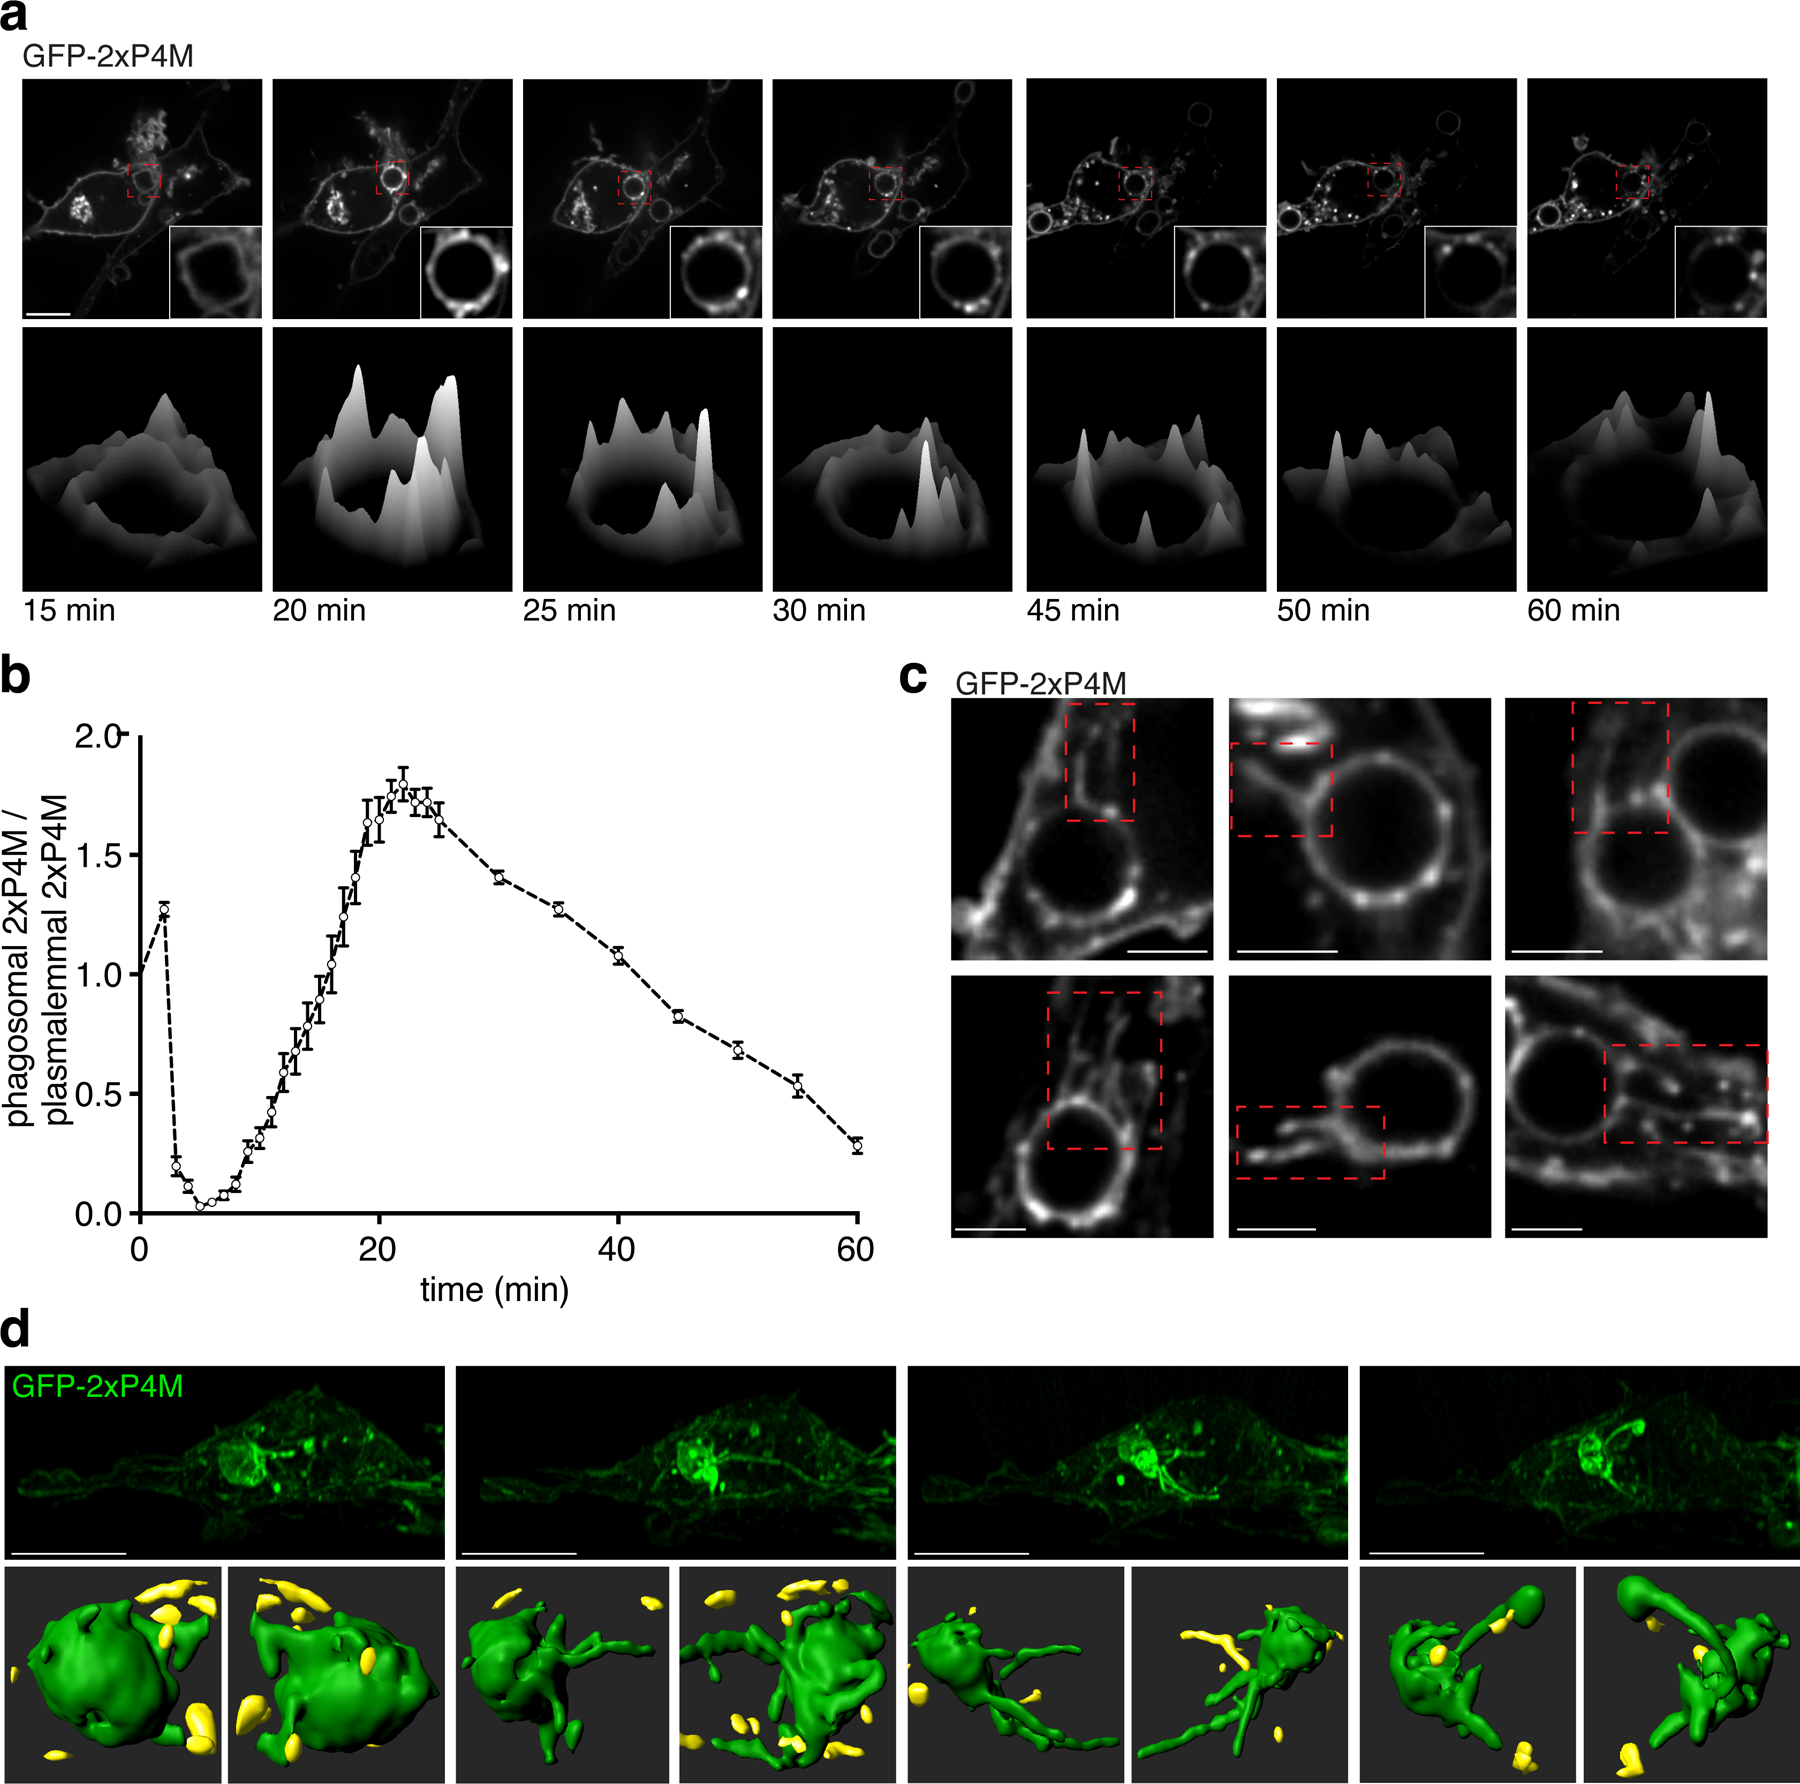
a) Top: time-lapse gallery of confocal micrographs acquired during phagocytosis of SRBC by RAW macrophages transiently expressing GFP-2xP4M showing multiphasic PtdIns4P dynamics; bottom: time-lapse surface intensity plots corresponding to the phagosome in the insets above; scale bar = 10 µm. b) Summary of tetra-phasic changes of PtdIns4P during phagocytosis; for quantitation, phagosomal fluorescence intensity was normalized to plasmalemmal fluorescence intensity; shown are means of 10 experimental replicates, error bars represent SEM. c) Confocal micrographs showing phagosomal tubules decorated with GFP-2xP4M. d) Top: side view of lattice light-sheet (LLS) time-lapse micrographs of RAW macrophages expressing GFP-2xP4M containing phagolysosomes; bottom: 3D surface reconstructions of GFP-2xP4M-positive phagosomes during tubulation for resolution. 3D reconstructions correspond to LLS micrographs on top; green surfaces are part of the phagosome and yellow surfaces are other compartments. Top scale bars = 10 µm; bottom scale bars = 3 µm.