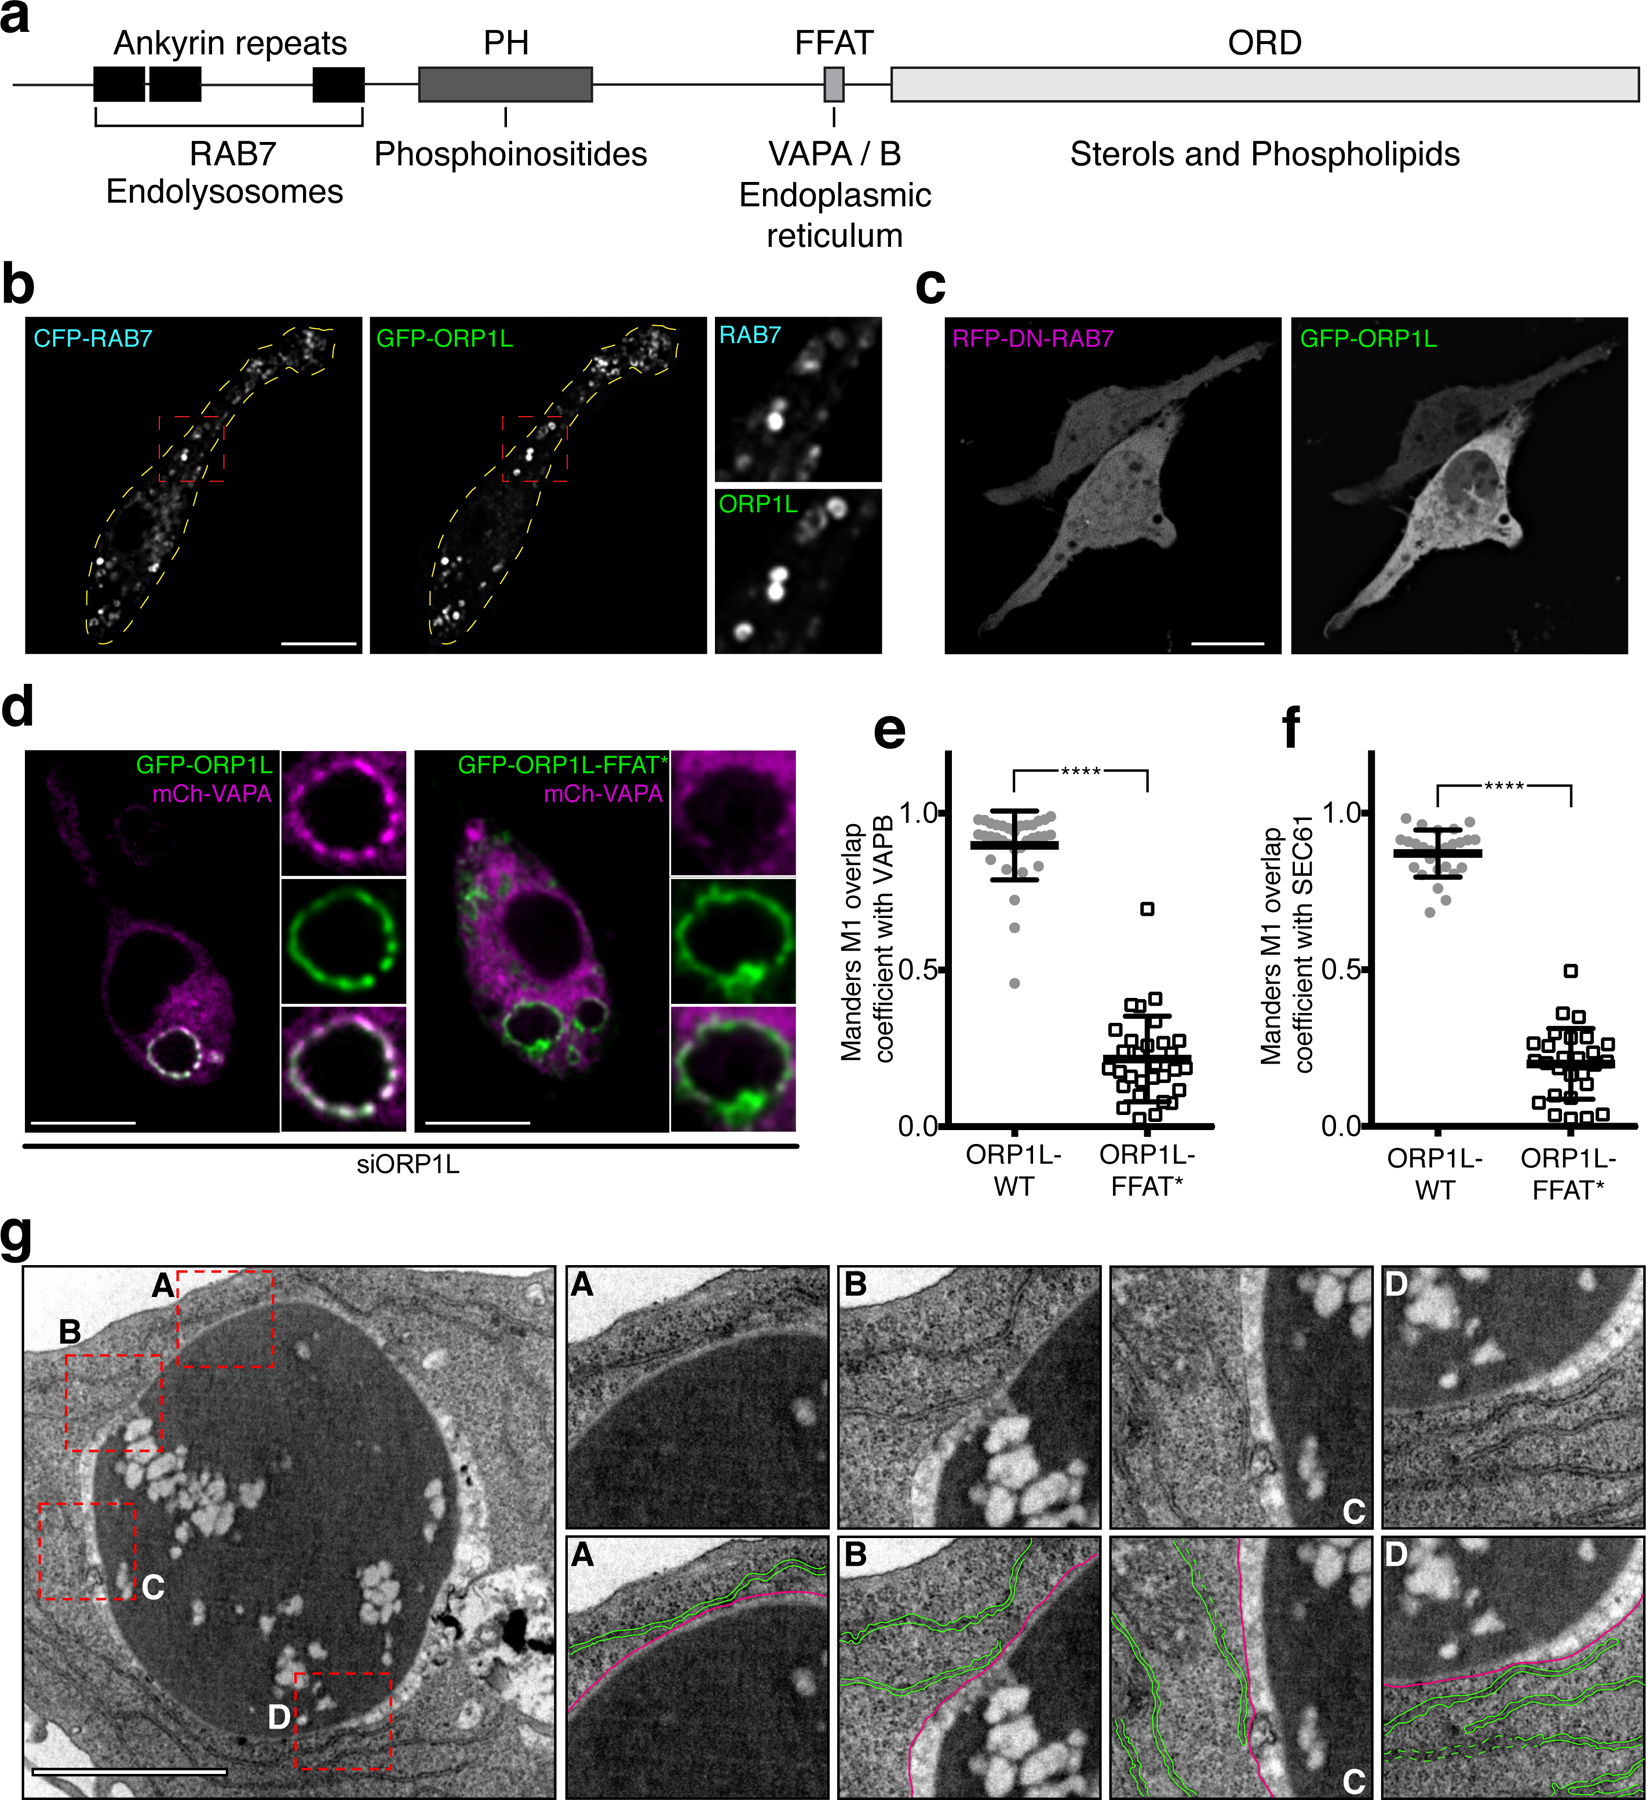
Figure 3. ORP1L accumulates in phagosomes during late maturation.

a) Schematic representation of functional domains of ORP1L. b) Confocal micrographs of RAW macrophages co-expressing GFP-ORP1L and RFP-RAB7 in RAW macrophages; insets are magnifications of red boxes; dotted yellow lines outline the cell periphery. c) Confocal micrographs of RAW macrophages co-expressing GFP-ORP1L and dominant-negative RFP-RAB7(T22N). d) Representative confocal micrograph of RAW macrophages co-expressing mCh-VAPA GFP-ORP1L (left) or mCh-VAPA and GFP-ORP1L-FFAT* (right) after 30 min of phagocytosis; insets show magnifications of the phagosome from the main micrographs. e) Graph showing the means and individual values of a Manders co-localization analysis of mCh-VAPB with either GFP-ORP1L (gray circles) or GFP-ORP1L-FFAT* (white squares); error bars in e-f represent standard deviations. Here and in subsequent figures ****p ≤ 0.0001. f) Graph showing the means and individual values of a Manders co-localization analysis of mCh-SEC61 with either GFP-ORP1L (gray circles) or GFP-ORP1L-FFAT* (white squares). g) Transmission electron micrograph of a RAW macrophage after 40 min of phagocytosis showing contacts between the ER and phagosomal membranes. Insets are magnifications of dotted red boxes. Bottom inset panels highlight ER membranes (colored in green) in contact with the phagosomal membrane (colored in magenta). Scale bar = 1 µm.
