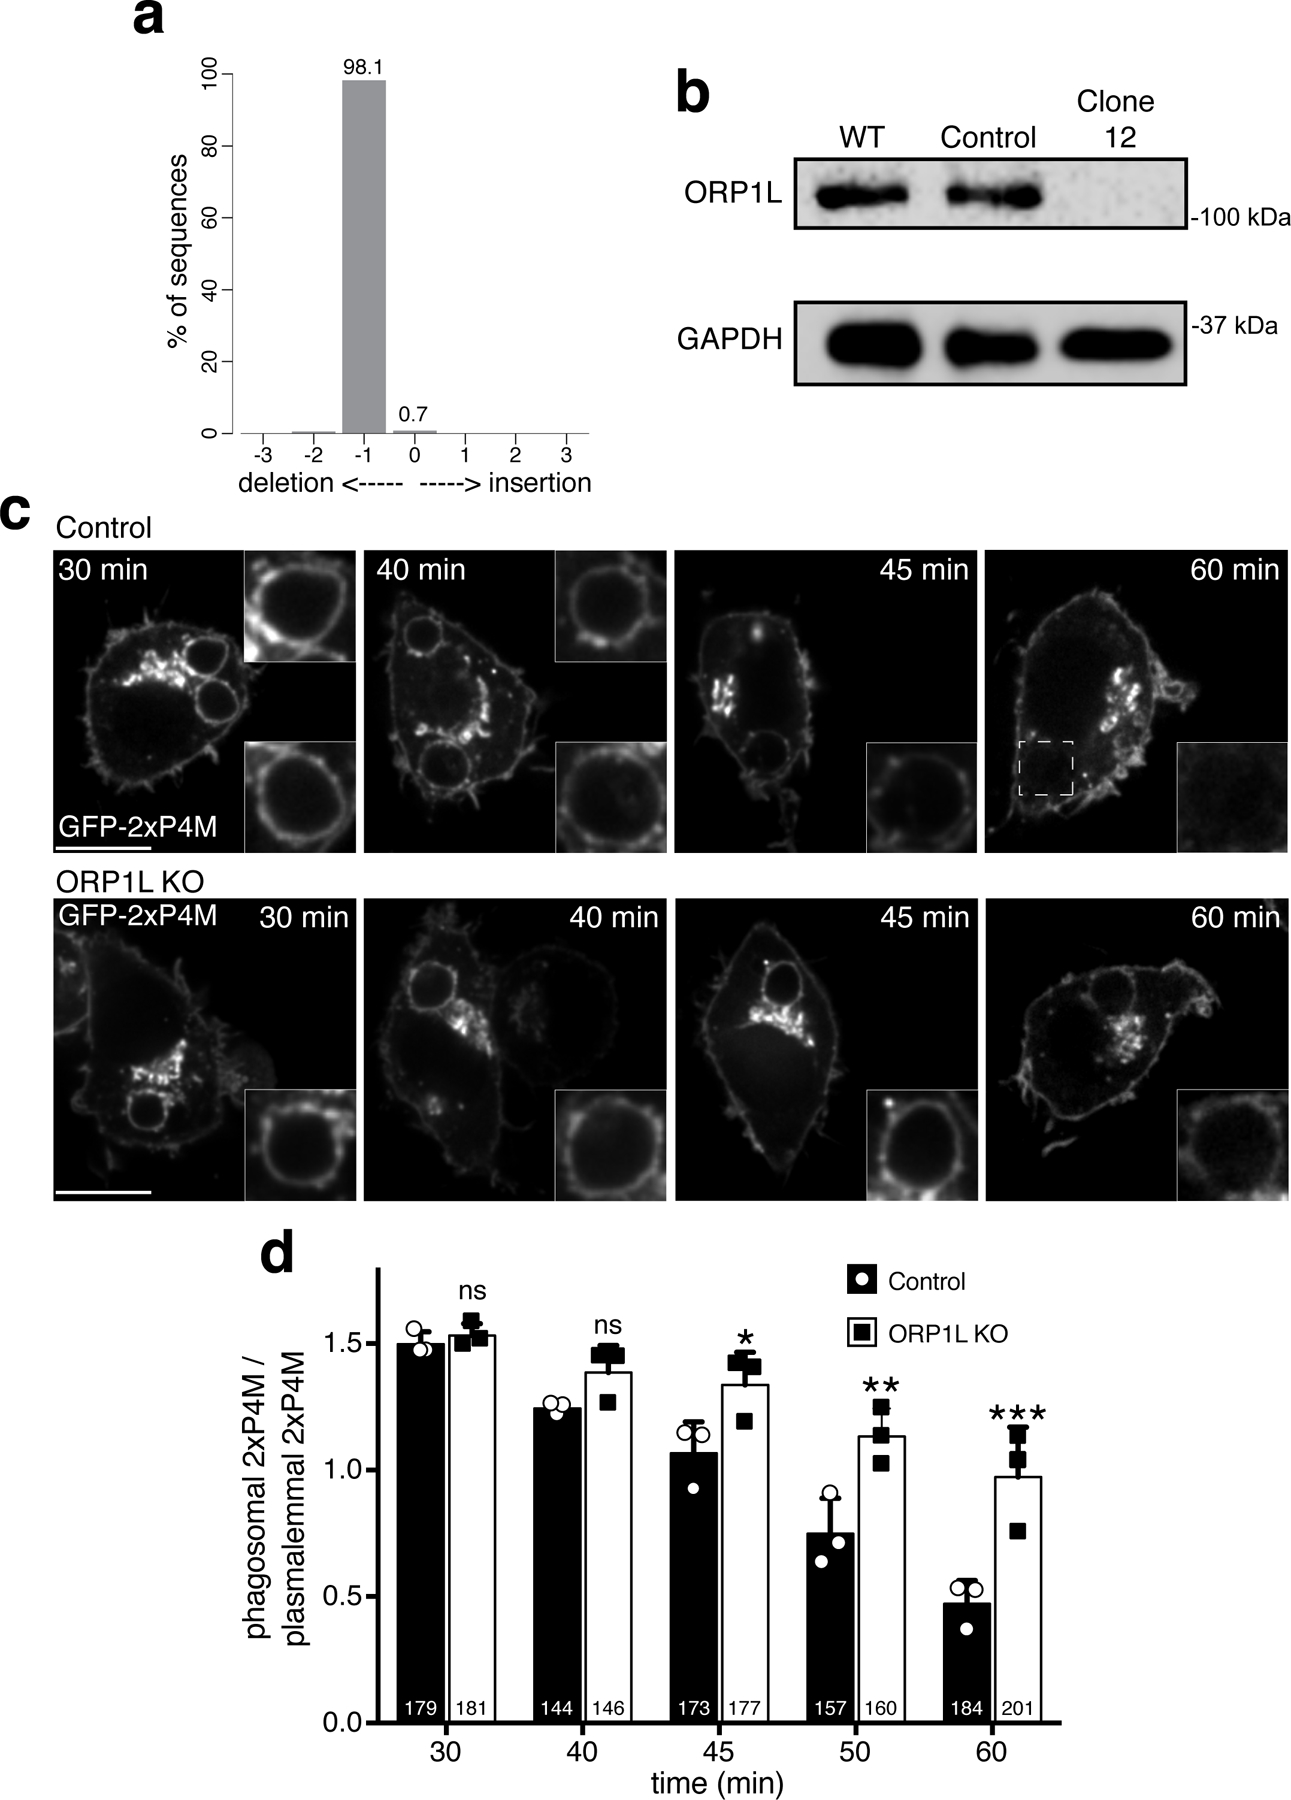
Figure 5. ORP1L transports PtdIns4P from maturing phagosomes to the ER.

a) Top: Representative confocal micrographs of control RAW macrophages expressing GFP-2xP4M at different times during phagosome maturation. Bottom: representative confocal micrographs of ORP1L KO RAW macrophages expressing GFP-2xP4M at different times during maturation. Scale bar = 10 µm. b) PtdIns4P dynamics in maturing phagosomes of control cells (black bars) and ORP1L KO cells (white bars); shown are means of normalized fluorescence intensity values of phagosomes per time-point, from 3 separate experiments (the number of individual phagosomes quantified is indicated within the bars); error bars represent SD; ***p ≤ 0.001 and ** p≤0.01, determined by two-way ANOVA comparing cell lines with multiple comparisons, using Sidak correction assuming statistical independence between groups. c) Representative confocal micrographs after 30 min of phagocytosis of: control RAW macrophages co-transfected with GFP-2xP4M and an mCh-vector and treated with siRNA targeting ORP1L (first column); in the following columns RAW macrophages were treated with siRNA targeting ORP1L and co-transfected with FP-2xP4M and different ORP1L constructs tagged with fluorescent proteins. d) Normalized FP-2xP4M fluorescence intensity of individual phagosomes of RAW macrophages expressing the indicated constructs. Data points are the number of experiments indicated in parentheses; medians with interquartile ranges are indicated. Significance calculated by two-tailed unpaired t tests. Scale bars = 10 µm.
