
Figure.
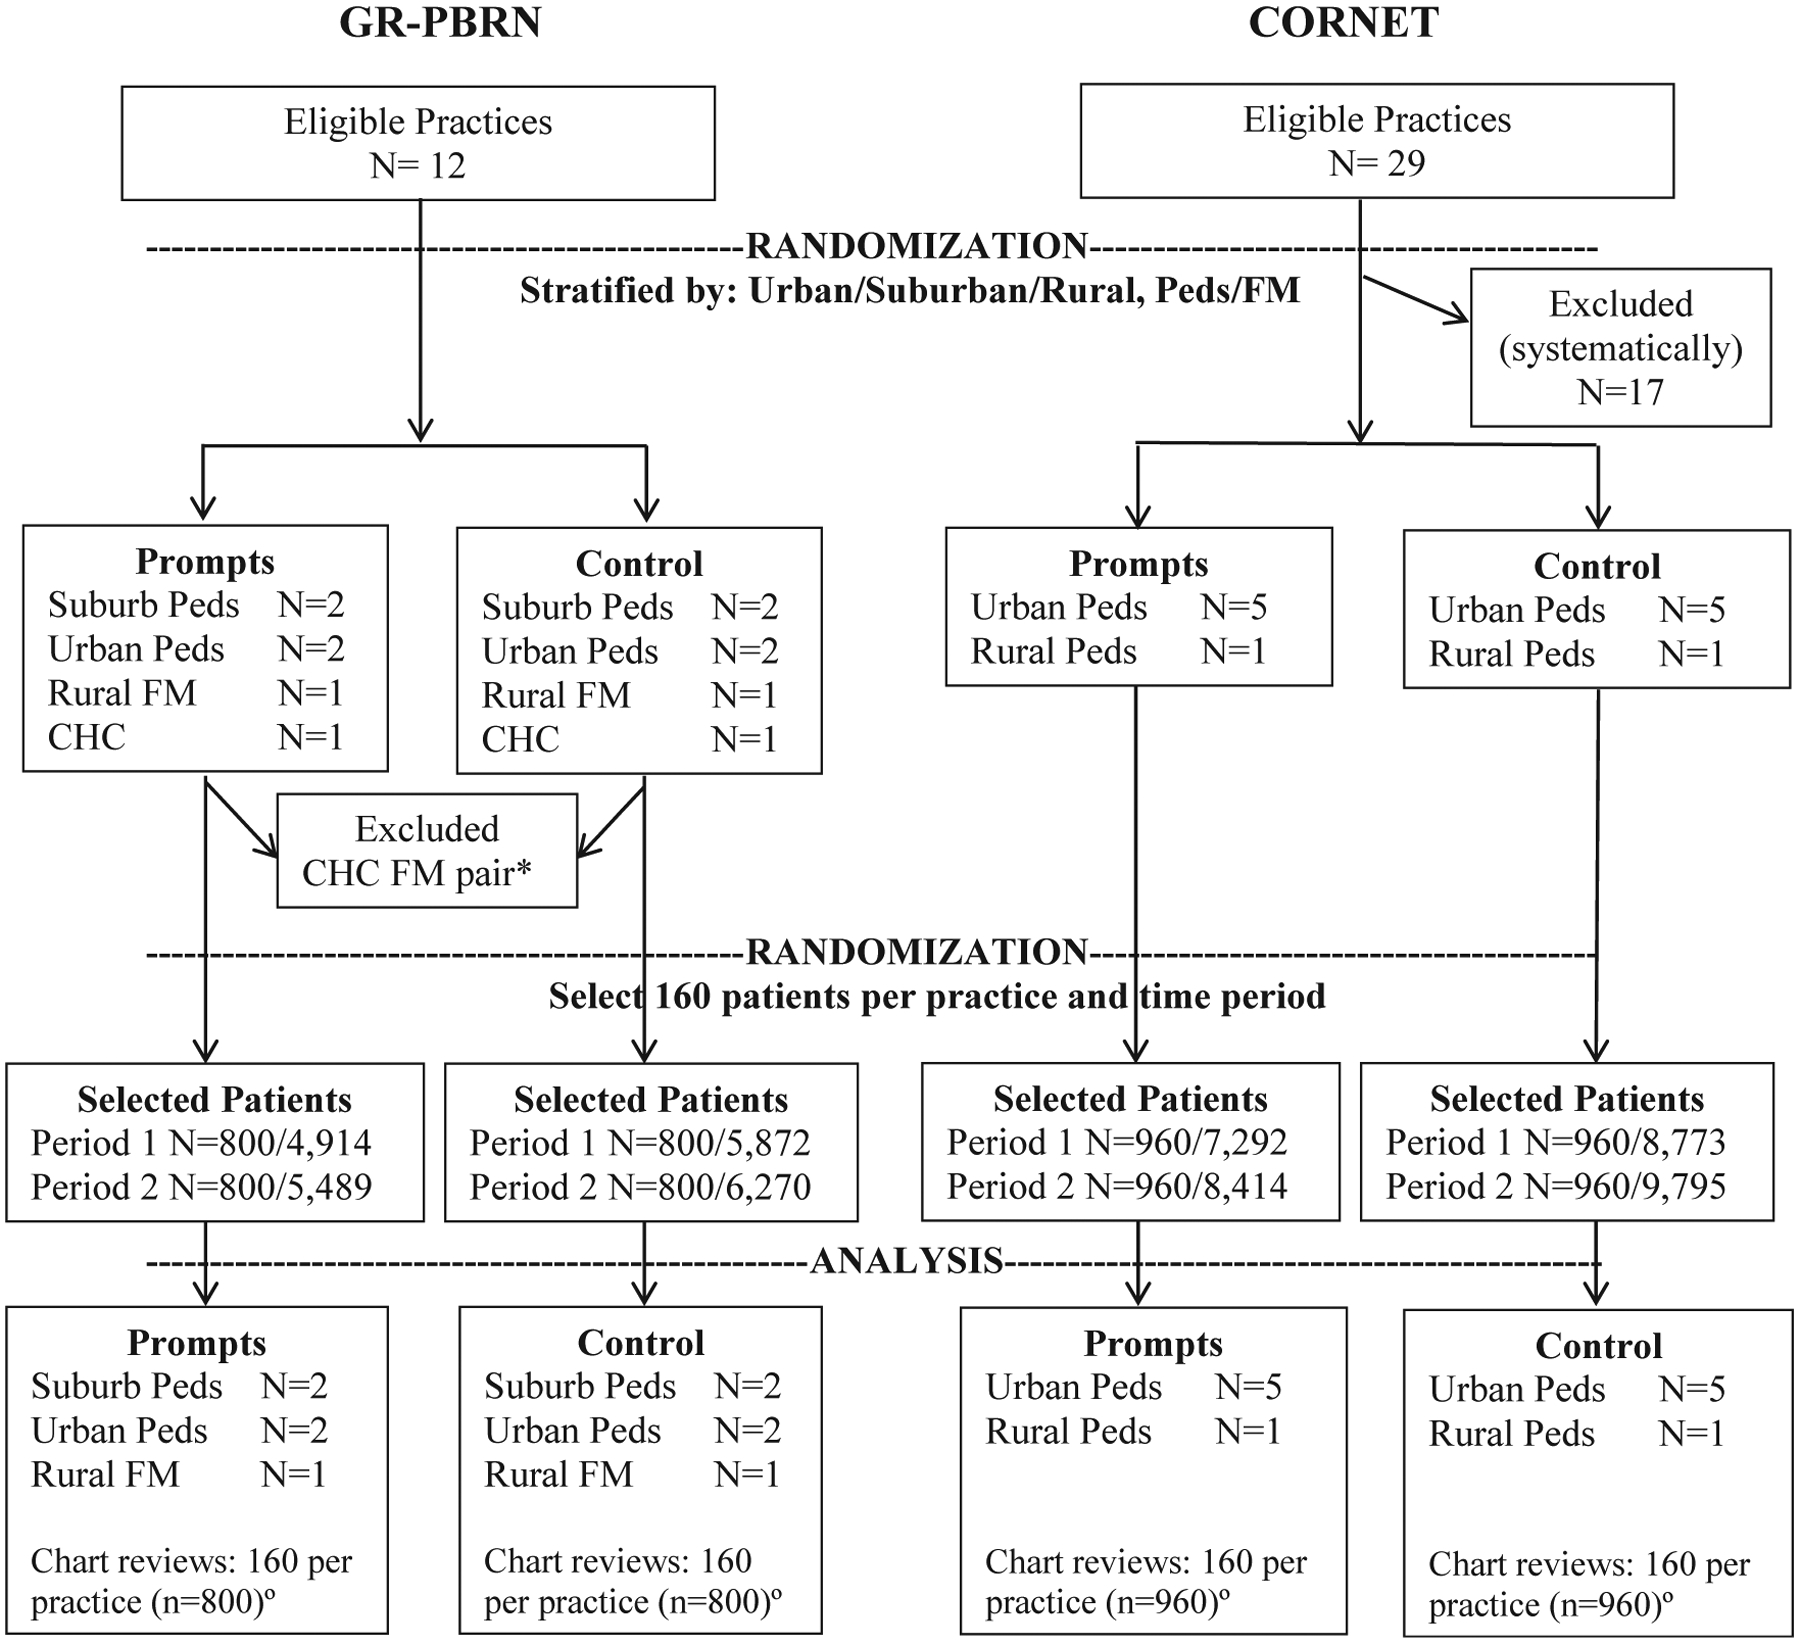
Flow diagram showing intervention (prompt) and control practices and subjects for chart reviews. Peds indicates pediatric practice; FM, family medicine practice; and CHC, community health center. *The CHC practice pair was excluded because the intervention practice was unable to perform prompts. °A random sample of adolescents who made a visit during the 12-month baseline or 12-month intervention period was selected for chart review; the same number of medical charts was reviewed for each time period (ie, n = 3,520 for the baseline period and n = 3,520 for the intervention period).