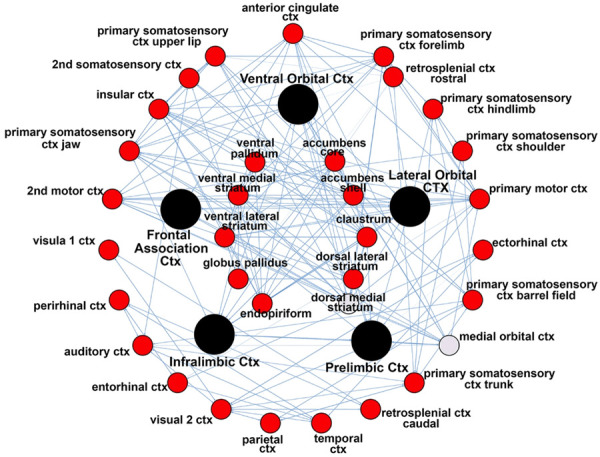
Figure 2.

Connectivity between nodes. The radial figure shows the connectivity between the nodes of the PFC highlighted as black circles and brain areas comprising the basal ganglia (inner circle) and cerebral cortex (outer circle). Circles highlighted in red denote specific brain areas that have significantly fewer degrees or connections to the PFC nodes. The gray circle denoting the medial orbital cortex was not significantly different from the PFC.
