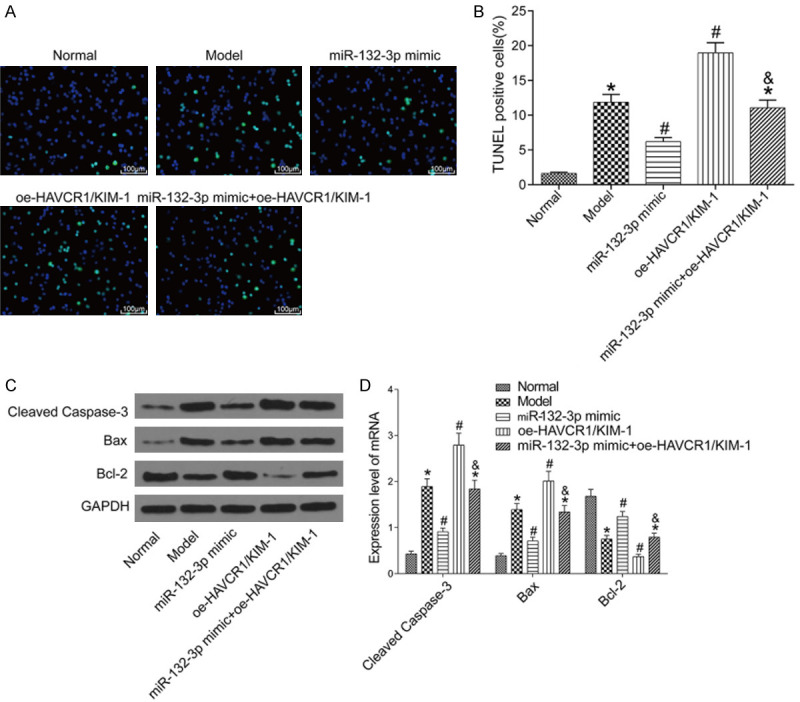
Figure 4.

Renal cell apoptosis in each group. A: TUNEL stain (200×); B: Renal cell apoptosis rate in each group; C: Western blot image; D: The protein expressions of apoptosis-associated factors in the renal tissues of each group (n=6). *P<0.05 vs. the normal group; #P<0.05 vs. the model group; &P<0.05 vs. the miR-132-3p mimic group. TUNEL: terminal deoxynucleotidyl transferase-dUTP nick end labeling.
