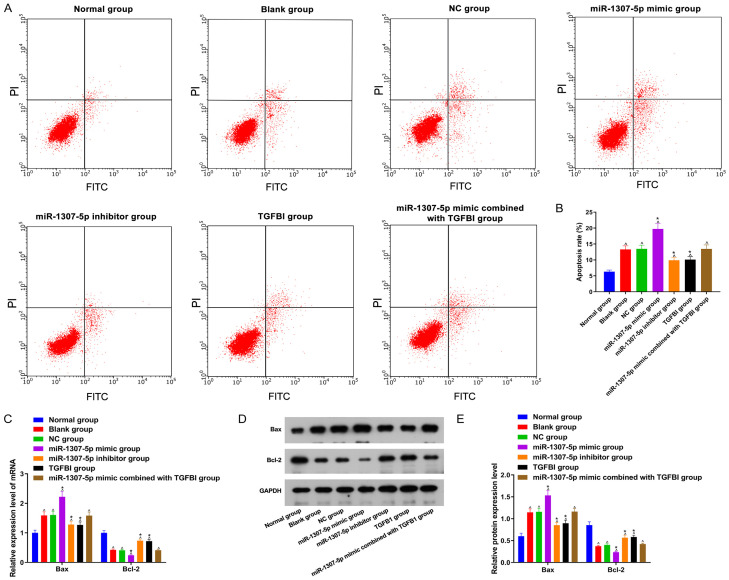
Figure 6.
Comparison of chondrocyte apoptosis among 7 groups. A: Chondrocyte apoptosis in each group; B: The rate of chondrocyte apoptosis in each group; C: Bcl-2 and Bax mRNA expression in each group; D: Bcl-2 and Bax protein expression in each group; E: Expression of Bcl-2 and Bax protein in each group. Compared with the normal group, ^P<0.05; compared with the blank group, *P<0.05. TGFBI: transforming growth factor beta-induced gene.

