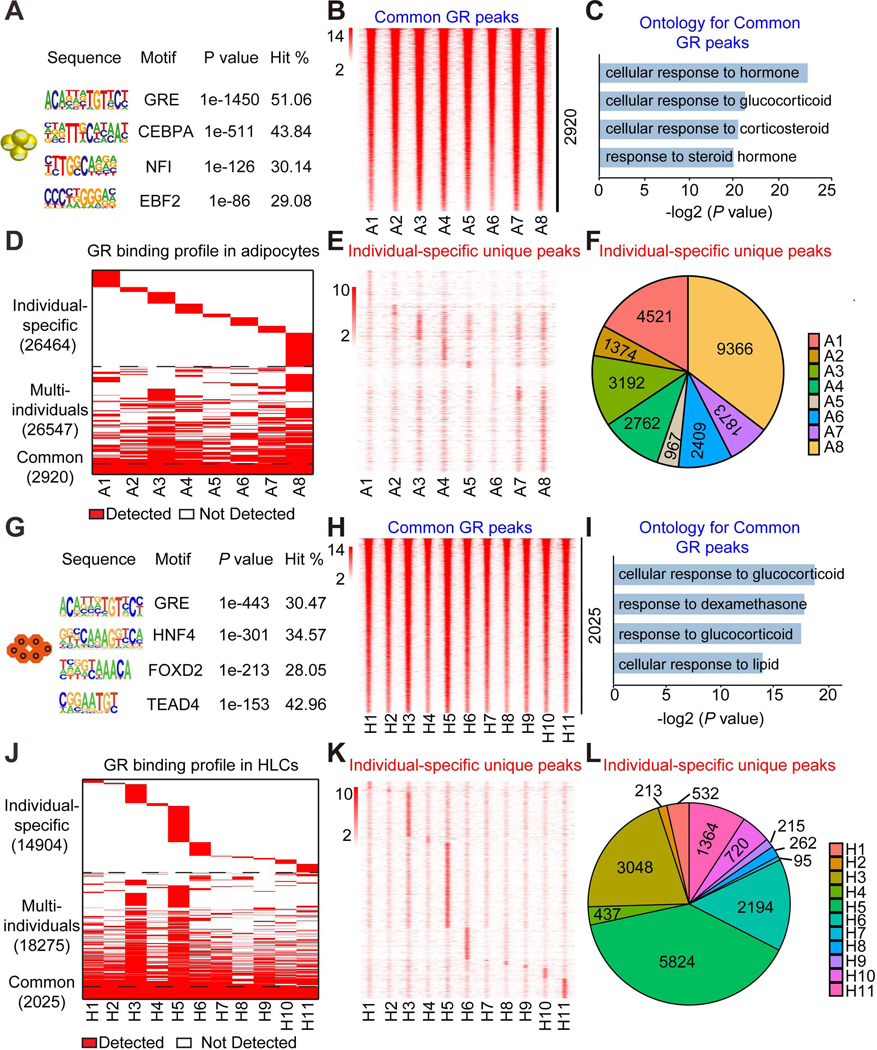
Figure 2. Differential Dex-induced genomic binding of GR in individual stem cell-derived adipocytes and HLCs.
(A) Consensus motif logos for the top-scoring motif families found in GR binding regions in adipocytes treated with Dex.
(B) Heatmap of common GR peaks that are detected similarly in adipocytes from all eight individuals. The color bar indicates the scale of normalized tag counts.
(C) Gene ontology for the nearest genes of GR binding sites that are detected similarly in adipocytes from eight individuals.
(D) Overall GR binding profile in adipocytes from eight individuals.
(E) Heatmap of individual-specific unique peaks that are specifically unique in adipocytes from only one individual.
(F) Proportion of individual-specific GR peaks that are specifically detected in adipocytes from only one individual.
(G) Consensus motif logos for the top-scoring motif families found in GR binding regions in HLCs treated with Dex.
(H) Heatmap of common GR peaks that are detected similarly in HLCs from all eleven individuals. The color bar indicates the scale of normalized tag counts.
(I) Gene ontology for the nearest genes of GR binding sites that are detected similarly in HLCs from all eleven individuals.
(J) Overall GR binding profile in HLCs from all eleven individuals.
(K) Heatmap of individual-specific unique peaks that are specifically unique in HLCs from only one individual.
(L) Proportion of individual-specific GR peaks that are specifically detected in HLCs from only one individual.
See also Figures S4–S5.

