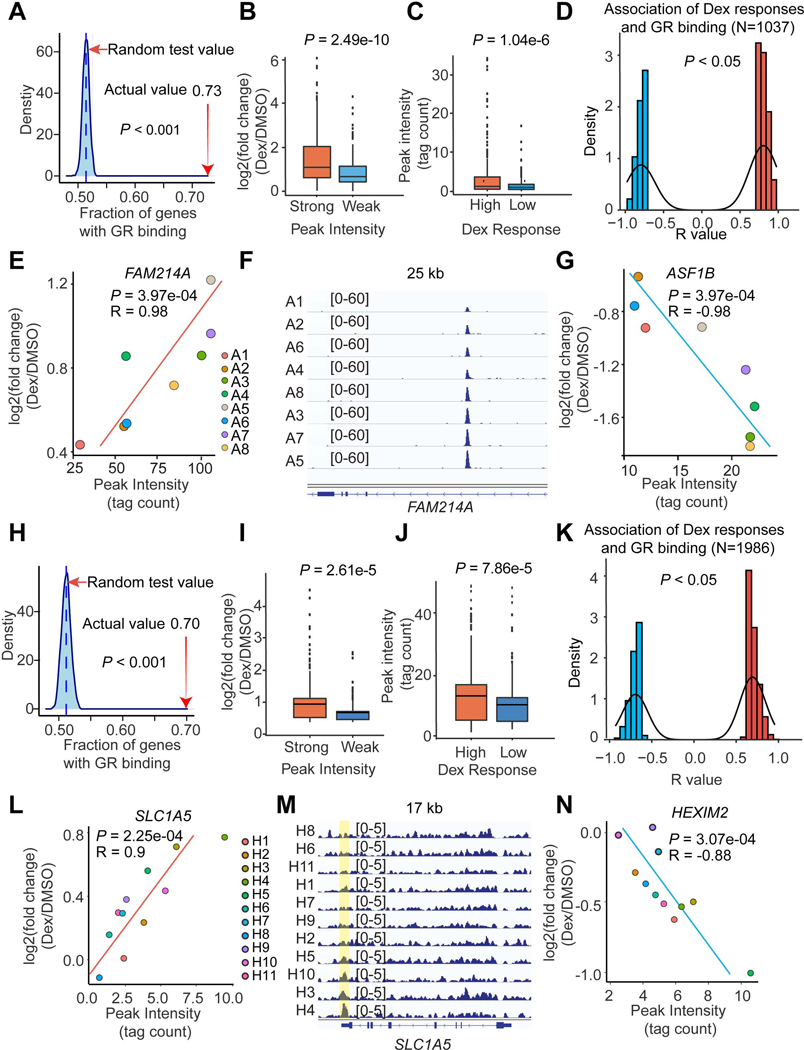
Figure 3. Differential GR binding drives individual-specific Dex responses.
(A and H) Dex-responsive genes are enriched in GR peaks in adipocytes (A) and HLCs (H) based on a random test. The percentage of Dex-responsive genes that have GR binding sites within 10 kb is indicated with a red arrow.
(B and I) The Dex responses near strong (Top 500 peaks) and weak (Bottom 500 peaks) GR binding sites in adipocytes (B) and HLCs (I).
(C and J) The GR binding intensities near high (Top 500 genes) and low (Bottom 500 genes) Dex-responsive genes in adipocytes (C) and HLCs (J).
(D and K) The number of gene-peak pairs in which gene responses to Dex are tightly associated with the intensities of GR bindings within 200 kb in adipocytes (D) and HLCs (K).
(E - G) Two example genes FAM214A (E) and ASF1B (G) whose responsiveness to Dex are positively or negatively associated with GR binding intensity in adipocytes. The GR-ChIP tracks at FAM214A locus were shown (F).
(L - N) Two example genes SLC1A5 (L) and HEXIM2 (N) whose responsiveness to Dex are positively or negatively associated with GR binding intensity in HLCs. The GR-ChIP tracks at SLC1A5 locus were shown (M).
The P values were calculated by permutation test (A and H), Student’s t-test (B, C, I and J) or R function cor.test (D, E, G, K, L and N).
See also Figures S6.

