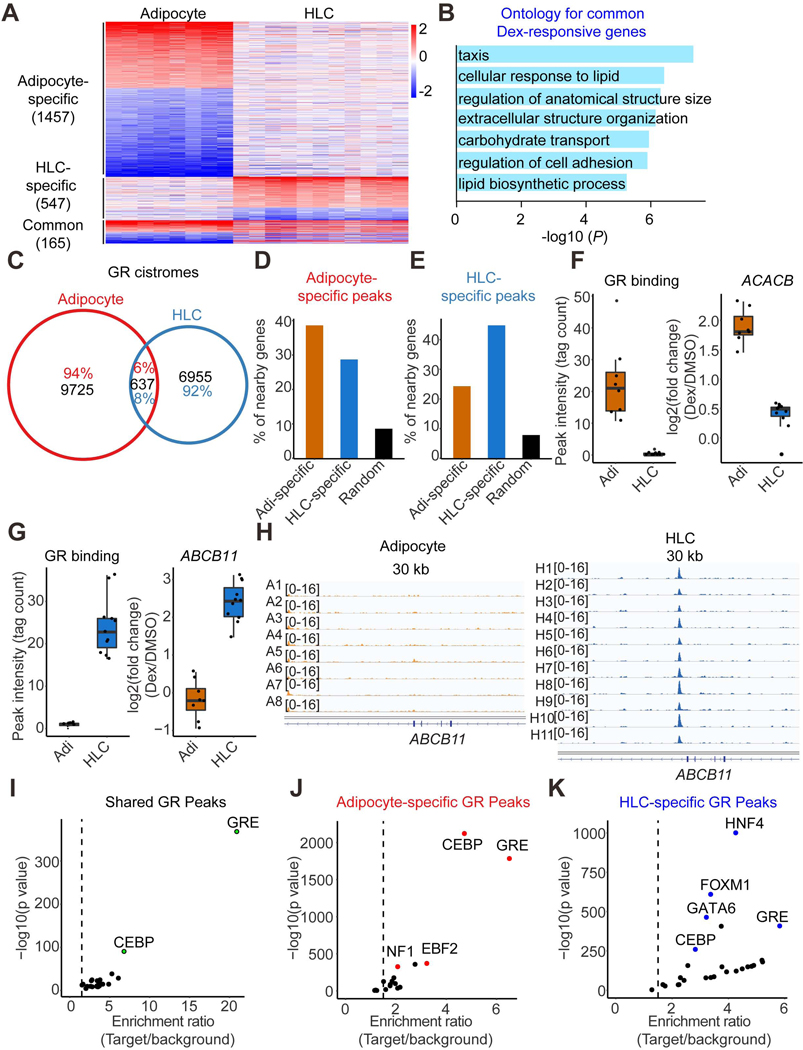
Figure 4. Cell type-specific Dex responses and GR genomic binding.
(A) Heatmap demonstrating the Dex-responsive genes in at least half of the individual adipocytes or HLCs. The color bar indicates log2(fold change) in Dex vs DMSO.
(B) Gene ontology for Dex-responsive genes observed in both adipocytes and HLCs.
(C) Venn diagram demonstrating the GR genomic binding in at least half of the individual adipocytes and HLCs.
(D and E) The percentage of adipocyte-specific Dex-responsive genes, HLCs-specific Dex-responsive genes or random genes that have nearby adipocyte-specific GR binding sites (D) or HLCs-specific GR binding sites (E).
(F) One example gene ACACB that’s induced by Dex in adipocytes only have higher nearby GR binding intensity in adipocytes compared to that in HLCs. Boxplots show median as a horizontal line, interquartile range as a box.
(G) One example gene ABCB11 that’s induced by Dex in HLCs only have higher nearby GR binding intensity in HLCs compared to that in adipocytes. Boxplots show median as a horizontal line, interquartile range as a box.
(H) GR ChIP-seq tracks at ABCB11 locus in adipocytes and HLCs.
(I-K) De novo motif analysis for common (I), adipocyte-specific (J) and HLC-specific (K) GR peaks.
See also Figures S7.

