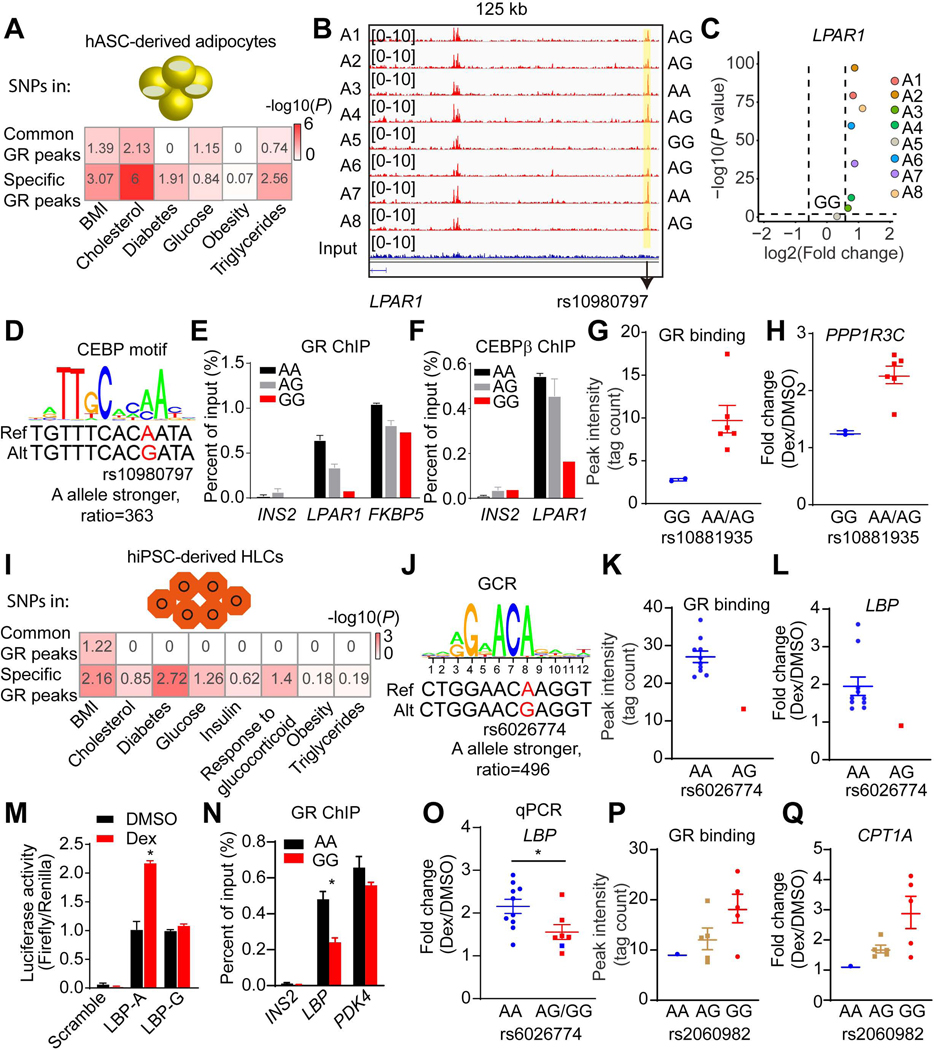
Figure 5. Genetic variants determine GR function and Dex responses.
(A and I) Enrichment of genetic variants associated with metabolic disorders in common or specific GR peaks in adipocytes (A) and in HLCs (I). The number is - log10 (P), which is also reflected by color.
(B) Visualization of an A5-specific absent peak region (yellow box) at LPAR1 locus across individual adipocytes. The black arrow indicates the position of rs10980797.
(C) Scatter plot showing the LPAR1 gene is not responsive to Dex in only individual A5 adipocytes.
(D) The putative effect of rs10980797 on CEBP motif.
(E and F) GR (E) and CEBPβ (F) ChIP-qPCR for LPAR1, FKBP5, and INS2 in eight individual adipocytes (2 A/A, 5 A/G and 1 G/G). Data are expressed as mean ± SEM.
(G and H) Differential GR binding near PPP1R3C locus (G) and Dex response of PPP1R3C (H) between different genotypes of rs10881935 across individual adipocytes. Data are expressed as mean ± SEM.
(J) The putative effect of rs6026774 on GR motif.
(K and L) Differential GR binding near LBP locus (K) and Dex response of LBP (L) between different genotypes of rs6026774 across individual HLCs. Data are expressed as mean ± SEM.
(M) The activities of luciferase reporters with the different alleles for rs6026774 and control reporter PGL4.24 in hepG2 cell lines treated with DMSO or Dex. Data are expressed as mean ± SEM.
(N) GR ChIP-qPCR for LBP, PDK4, and INS2 in HLCs (9 A/A and 2 G/G). Data are expressed as mean ± SEM.
(O) mRNA expression of LBP was examined by qPCR in 17 individual HLCs. Blue dots represent repeated experiment of individuals H1-H11. Red dots represent new HLCs (4 A/G, 2 G/G). Data are expressed as mean ± SEM fold change due to Dex.
(P and Q) Differential GR binding near CPT1A locus (P) and Dex response of CPT1A (Q) between different genotypes of rs2060982 across individual HLCs. Data are expressed as mean ± SEM.
*P < 0.05, by Student’s t-test (M, N and O).
See also Figures S8.

