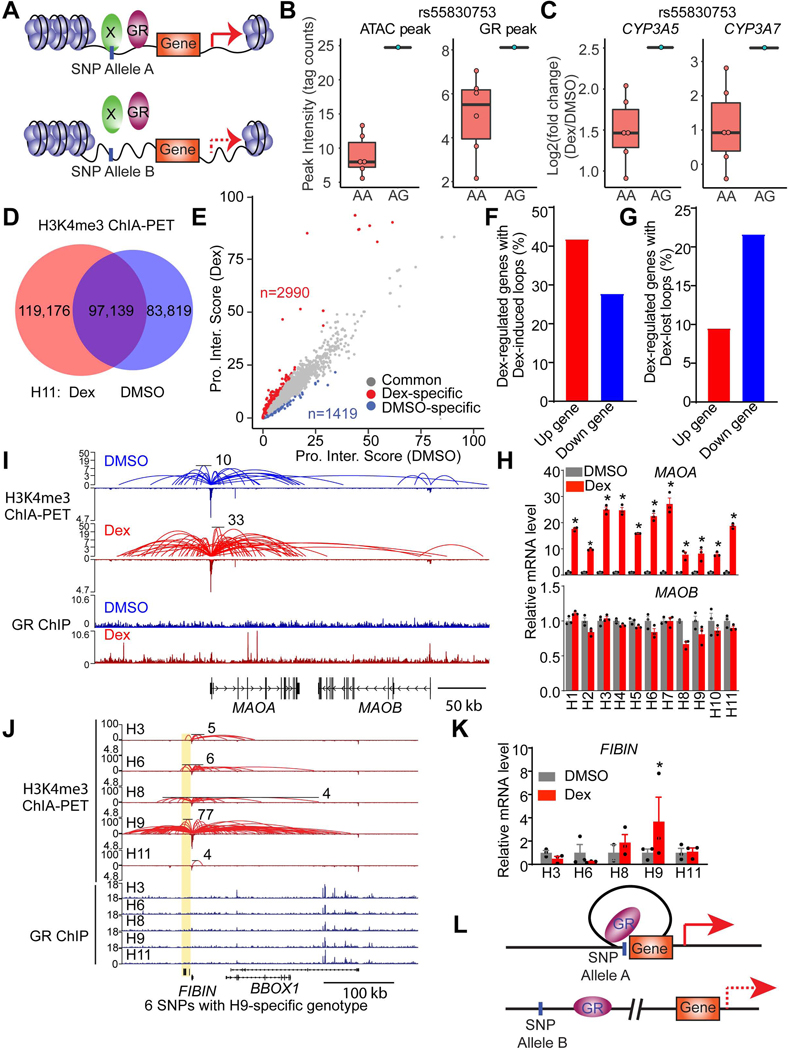
Figure 6. Genetic variations modulate GR function through affecting chromatin accessibility and architecture.
(A) Diagram depicting SNPs modulate gene response to Dex by affecting chromatin accessibility.
(B and C) rs55830753 affects ATAC-seq (left of B) signal and GR binding (right of B) near CYP3A5 and CYP3A7 locus and modulates their response to Dex (C).
(D) Venn diagram demonstrating the numbers of H3K4me3-mediated loops in DMSO- or Dex-treated H11 HLCs.
(E) Scatter plot revealing the genes whose promoter interaction score is 2 fold higher in Dex or DMSO group. Promoter interaction score represents the total PET number of each gene promoter.
(F and G) The percentage of Dex-responsive genes with Dex-specific interactions (F) or DMSO-specific interactions (G).
(H) mRNA expression of MAOA and MAOB in HLCs from eleven individuals, normalized to DMSO, as measured by RNA-seq. Data are expressed as mean ± SEM.
(I) Visualization of promoter-enhancer interactions (Top) and GR binding (Bottom) at MAOA and MAOB locus in DMSO or Dex-treated H11 HLCs. The scale of Y-axis of ChIA-PET is a log scale.
(J) Visualization of promoter-enhancer interactions (Top) and GR binding (Bottom) at FIBIN locus in five Dex-treated HLCs. Yellow box indicates genomic regions with H9-specifc promoter-enhancer loops and H9-specific genotypes. The scale of Y-axis of ChIA-PET is a log scale.
(K) mRNA expression level of FIBIN in HLCs from five individuals, normalized to DMSO, as measured by RNA-seq. Data are expressed as mean ± SEM.
(L) Diagram depicting the mechanisms of SNPs that modulate gene response to Dex by affecting the generation of loops.
*P < 0.05, by Student’s t-test (H and K).
See also Figures S9.

