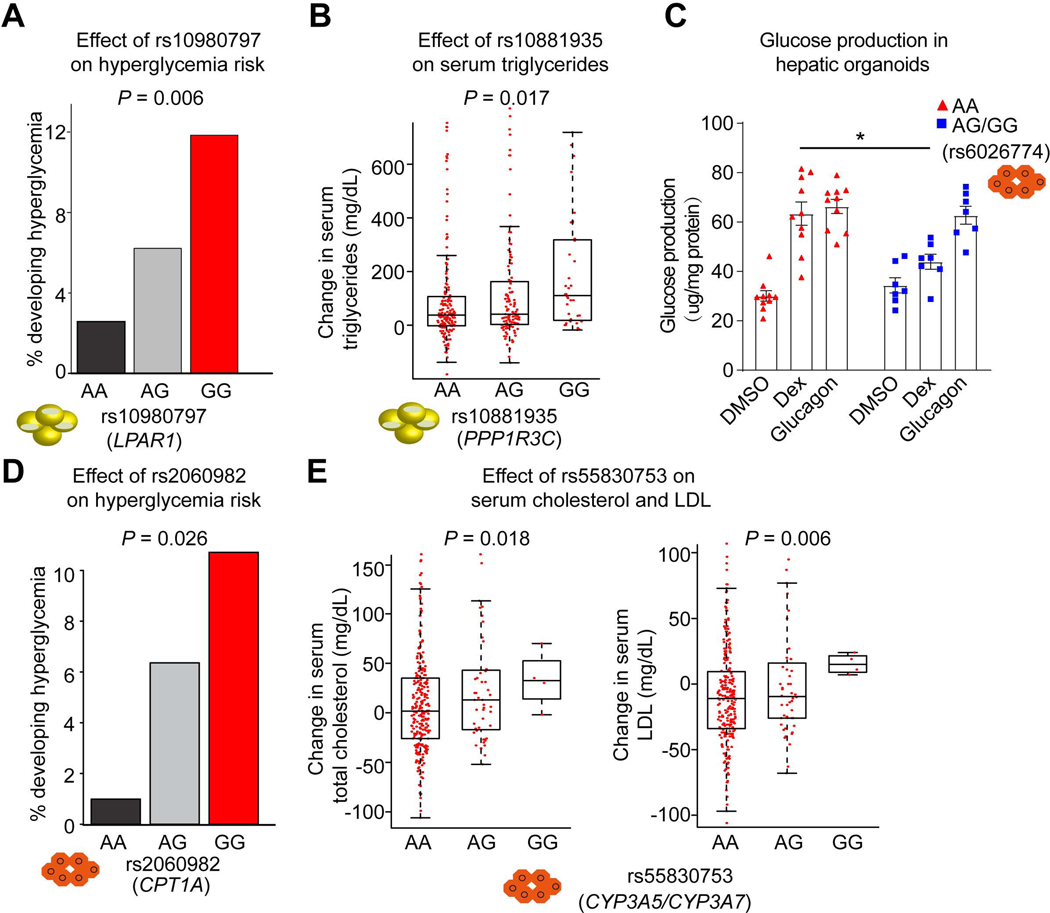
Figure 7. Genetic variants determine metabolic side effects of GC therapy.
(A) Percentage of pediatric individuals carrying each genotype of rs10980797 becoming hyperglycemic (>160 mg/dL) during treatment. 117 AA, 194 AG and 76 GG children with ALL who received chemotherapy with glucocorticoids.
(B) The change of triglyceride level after Dex treatment (Continuation Week8 – Week7) in individuals with ALL carrying different genotypes at rs10881935. Boxplots show median as a horizontal line, interquartile range as a box.
(C) Glucose production in hepatic organoids with different genotypes at rs6026774 treated with DMSO, Dex and Glucagon. 10 AA (red) and 7 AG or GG (blue) iPSC-derived hepatic organoids. Data are expressed as mean ± SEM. *P < 0.05 (Student’s t-test).
(D) Percentage of pediatric individuals with ALL carrying each genotype of rs2060982 becoming hyperglycemic (>160 mg/dL). 112 AA, 173 AG and 102 GG.
(E) The change of total cholesterol level (left) and LDL level (right) after Dex treatment (Continuation week8 – week7) in individuals with ALL carrying different genotypes at rs55830753.
The P value was calculated by multiple logistic regression analysis (A, B, D and E). See also Figures S10.

