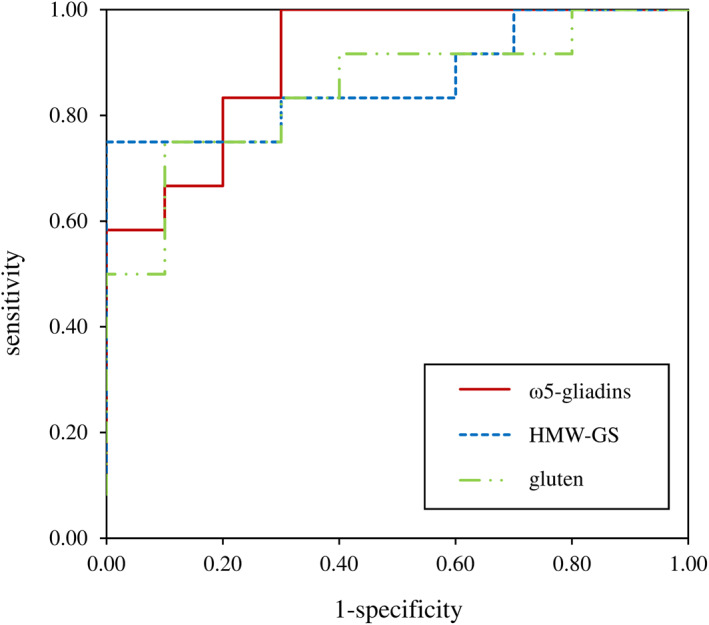
FIGURE 3.

Concentration‐independent receiver operating characteristic curves for ω5‐gliadins, high‐molecular‐weight glutenin subunits (HMW‐GS), and gluten, which had the highest sensitivity and specificity. The maximum basophil activation %CD63+ basophils out of all tested concentrations for each single allergen test solution in patients and controls was taken to generate ROC curves
