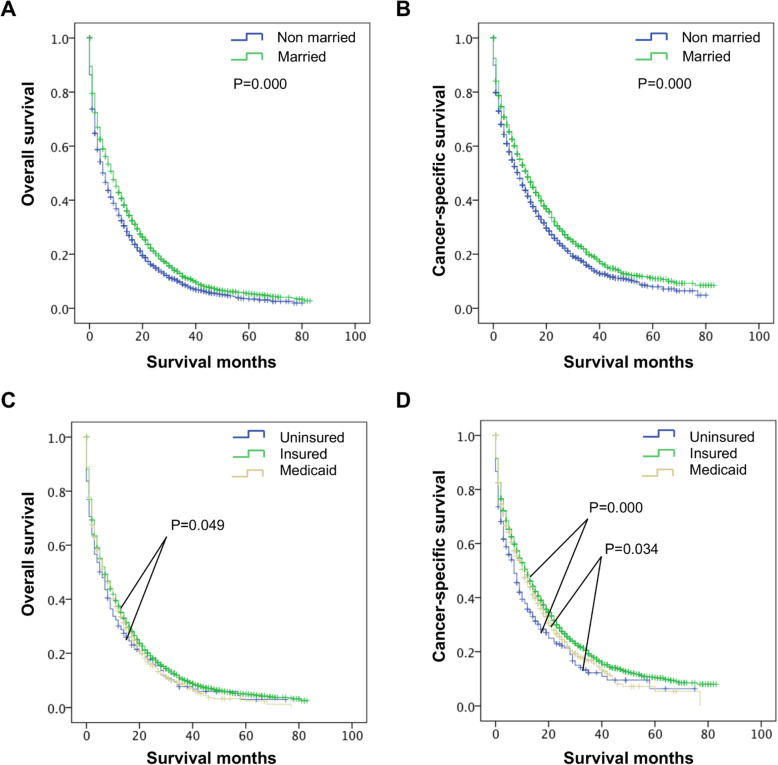
Fig. 2.
Long-term survival of of elderly M1b colon cancer patients according to marital status and insurance status, respectively. A, B the survival curves showed that the OS and CSS of the Non-married group were poorer than that of the Married group C, D the survival curves showed that the OS and CSS of the Uninsured group was poorer than that of the Insured group. C the Medicaid group had the similar OS with other subgroups. D the Medicaid group had the similar CSS with Insured group but had a better CSS than Uninsured group. OS, overall survival; CSS, cancer-specific survival

