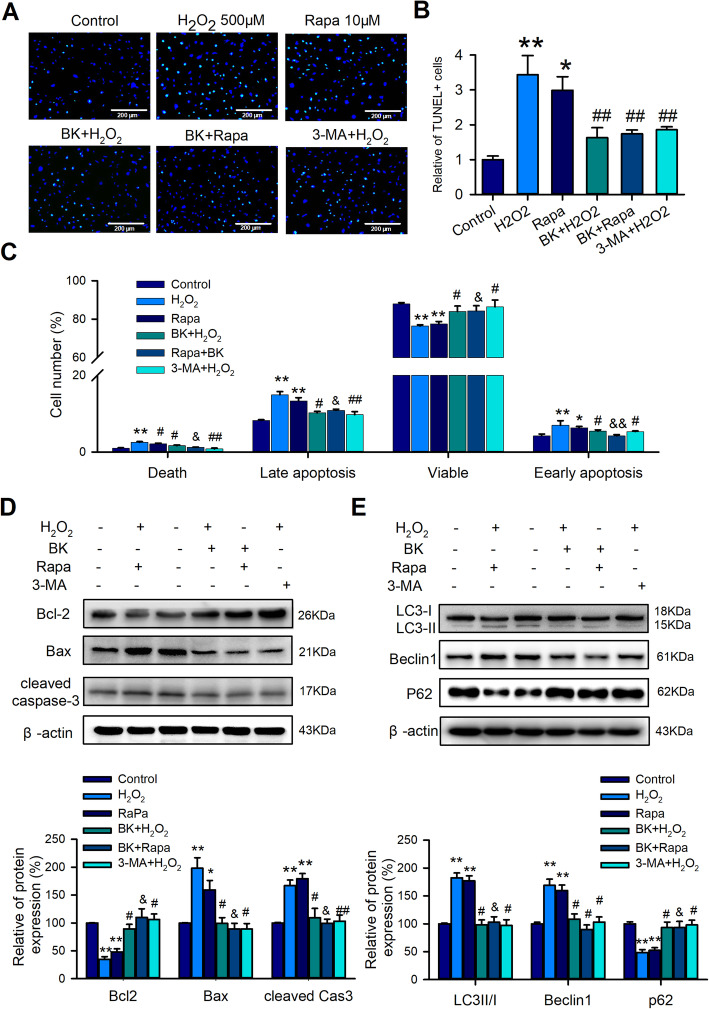
Fig. 3.
Autophagy participated in the BK-regulated apoptosis induced by H2O2 in hCPCs. A–B Representative image and quantitative analysis of TUNEL staining in hCPCs induced by H2O2 or rapamycin and treatment with BK or 3-MA. C Quantitative analysis of Annexin V flow cytometry assay in hCPCs induced by H2O2 or rapamycin and treatment with BK or 3-MA. D Apoptosis-related protein expression, including Bax, Bcl-2, cleaved caspase 3, induced with H2O2 or rapamycin, and treatment with BK or 3-MA. E Autophagy-related protein expression, including LC3II/I, Beclin 1, and P62, induced with H2O2 or rapamycin and treatment with BK or 3-MA. (Data are shown as mean ± SEM, n = 5, *P < 0.05, **P < 0.01 VS. control; #P < 0.05, ##P < 0.01 VS. H2O2; &P < 0.05, &&P < 0.01 VS. Rapa)

