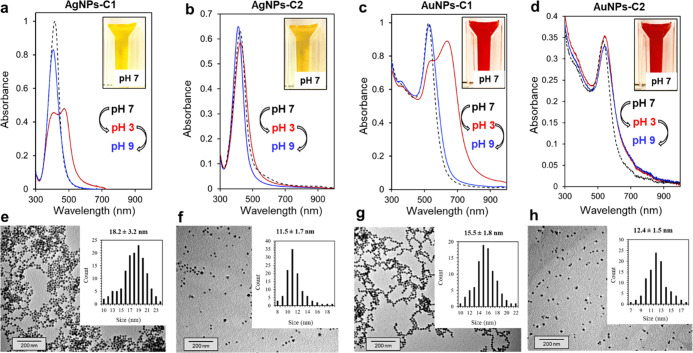
Figure 1.
UV–vis spectra of (a) AgNPs-C1, (b) AgNPs-C2, (c) AuNPs-C1, and (d) AuNPs-C2 suspended in water at pH 7 (black dashed line), pH 3 (red plain line), and pH 9 (plain blue line). Insets show pictures of the suspensions at pH 7. TEM images of (e) AgNPs-C1, (f) AgNPs-C2, (g) AuNPs-C1, and (h) AuNPs-C2 with corresponding histograms based on the measurement of >100 NPs.

