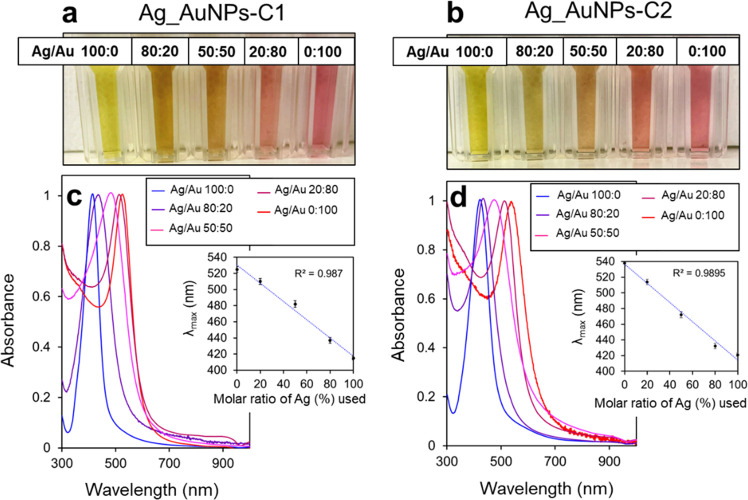
Figure 6.
Pictures of suspensions of (a) Ag_AuNPs-C1 and (b) Ag_AuNPs-C2 produced with different molar ratios of AgNO3 (%) and HAuCl4 and (c and d) corresponding normalized UV–vis spectra. Insets show the position of the maximum of absorbance as a function of the molar ratio of AgNO3 (%) used during the synthesis.

