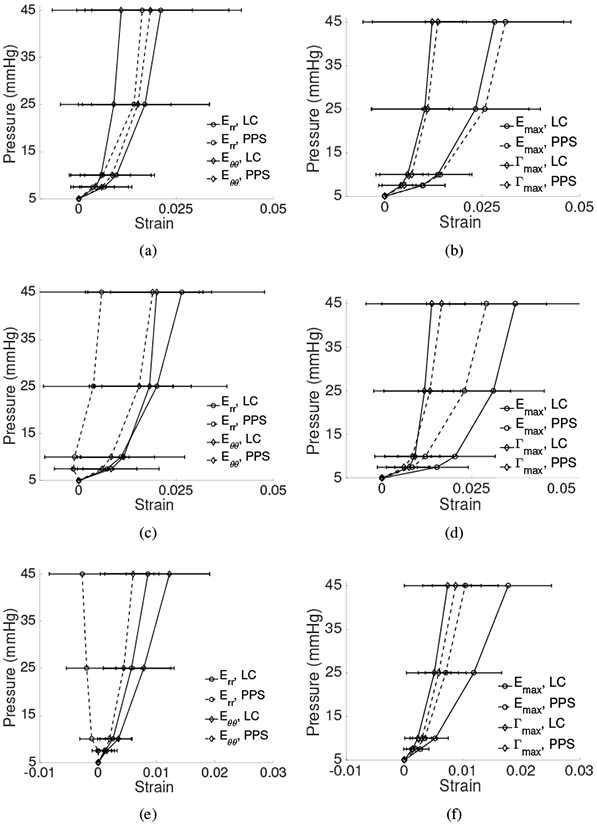
Figure 4:

The specimen-averaged pressure-strain response for inflation from 5-45 mmHg, the sum of the pressure increments 5-10 and 10-45 mmHg, in the LC (—) and PPS (- -) for Err, Eθθ (left column) and Emax, Γmax (right column) for: a-b) Specimen 1, c-d) Specimen 2, and e-f) Specimen 13. Deformation within the LC was predominantly tensile with small Γmax. Err was smaller in the PPS compared to the LC and could be (a) tensile, (c) near-zero, or (e) compressive on average. Error bars indicate ±1 standard deviation.
