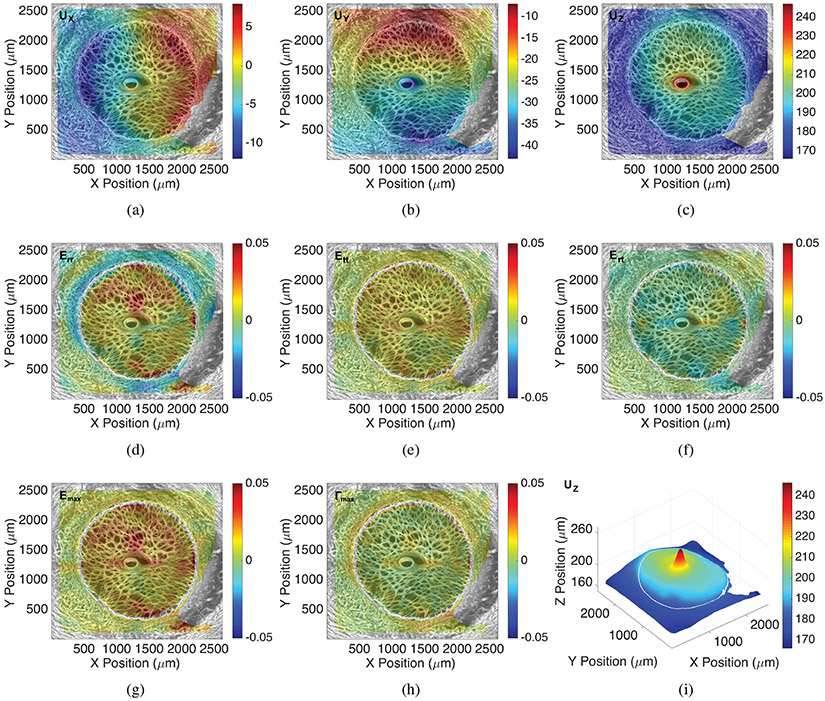
Figure 5:
Colored contour maps for the thickness-averaged full-field displacement (μm) and strain response for inflation from 5-45 mmHg, the sum of the pressure increments 5-10 and 10-45 mmHg, calculated by DVC from the TPF volume for Specimen 11, showing the displacement components a) UX, b) UY, c) UZ, and strain components d) Err, e) Eθθ, f) Erθ, g) Emax, h) Γmax. i) The 3D plot of the posterior displacement UZ displacement showing the deformed shape. This LC exhibited large posterior bowing relative to the PPS. In the LC, Err and Eθθ were tensile. For this specimen, Eθθ was tensile and Err was compressive in the PPS. The Γmax was largest at the LC-PPS interface. The maximum intensity projection of the TPF images are overlaid for illustrative purposes.

