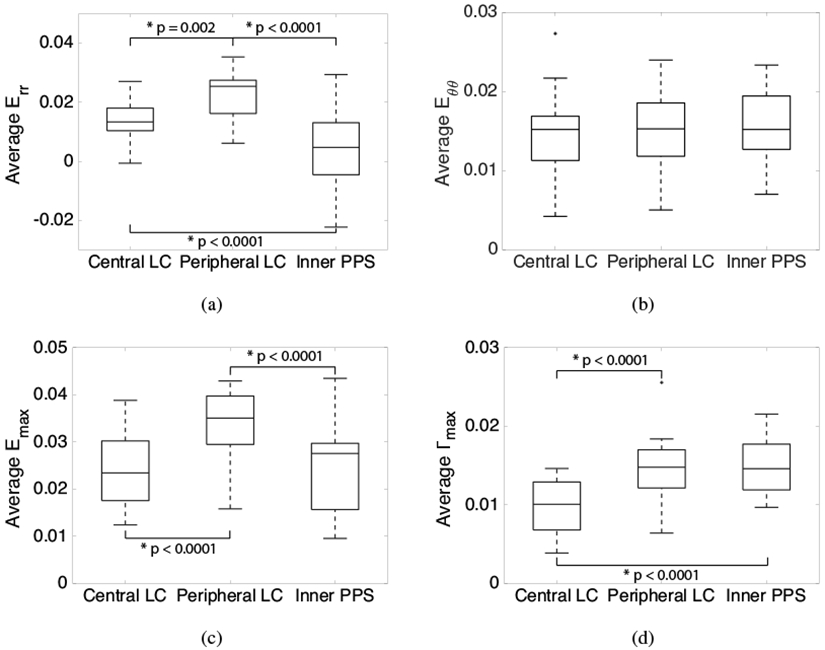
Figure 7:

Comparison of average strain in the central LC, peripheral LC, and inner PPS (n = 13) for inflation from 5-45 mmHg, the sum of the pressure increments 5-10 and 10-45 mmHg: a) Err is largest in the peripheral LC, b) Eθθ is similar in all 3 regions, c) Emax is largest in the peripheral LC, and d) Γmax is smallest in the central LC. Box plots were generated using the Matlab function boxplot where the central line within each box represents the median of the group, the top and bottom edges of each box represent the 25th and 75th percentiles respectively, the whisker lengths extend to the most extreme values not considered outliers, and the outliers (+’s) are the values outside of the ±2.7σ range.
