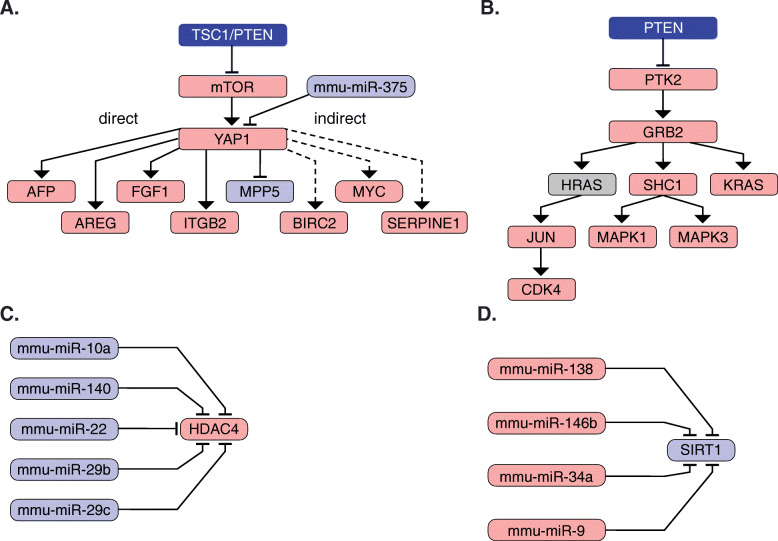
Fig. 4.
A. Aberrant upstream and downstream interactors of YAP1. Upstream interactors include one significantly downregulated miRNAs (miR-375) and interaction with TSC1 and PTEN. Downstream, YAP1 interacts directly or indirectly with several genes the RNA expression of which has been found significantly upregulated. B. Aberrant upstream and downstream interactors of GRB2 are shown. Upstream interactors include an indirect interaction with PTEN (through PTK2). Downstream, GRB2 interacts with several genes like SHC1, K-RAS, JUN and CDK4. C. miRNAs upstream of HDAC4 significantly downregulated in HCC tumors compared to the control tissue. D. miRNAs upstream of SIRT1 significantly upregulated in HCC tumors compared to the control tissue. The expression counts have been normalized with respect to library sizes and have been transformed for variance stabilization. Shown are normalized expression counts of the miRNAs upstream of Sirt1. The expression counts have been normalized in the same way as in C. Blue color indicates downregulated or genomic deletion, grey color indicates not regulated and red color indicates upregulation

