Figure 1.
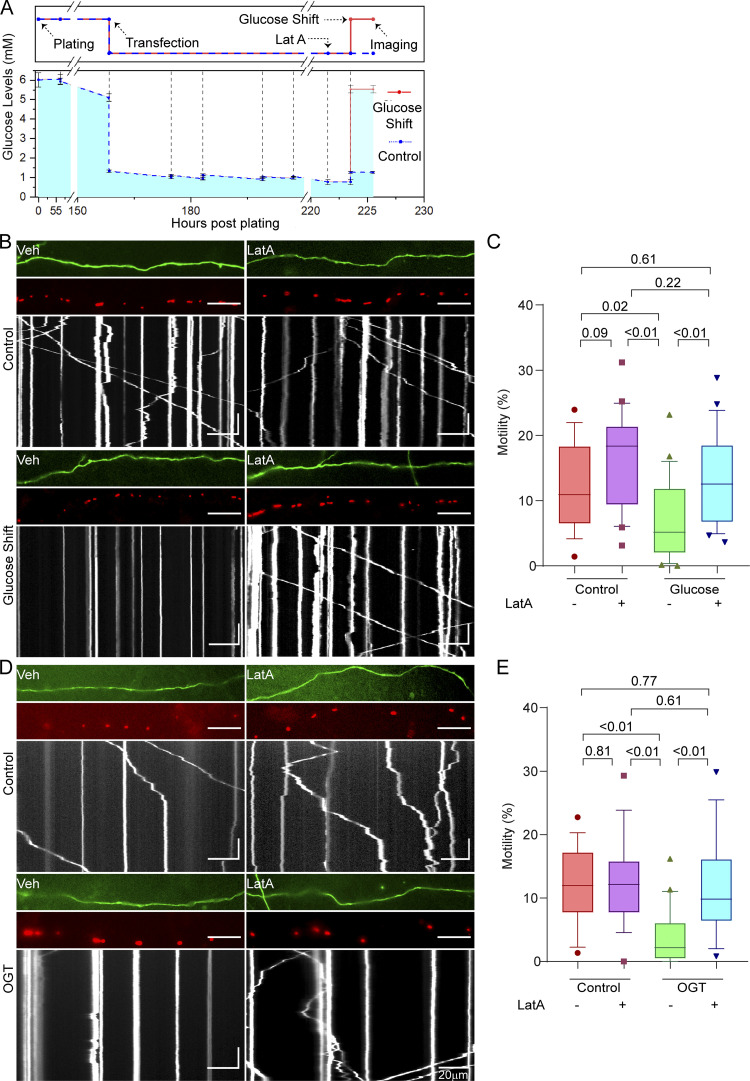
Glucose- and OGT-induced arrest of neuronal mitochondrial motility requires F-actin. (A) Experimental timeline and measured glucose levels for neuronal glucose shift experiments. Experimental outline (top) is aligned with measured glucose levels (bottom). Primary neurons were dissected in standard neurobasal media (containing 25 mM glucose). Neurons were then washed and plated in low-glucose media (containing 5 mM glucose). At the time of plating, the glucose levels are slightly higher than 5 mM due to incomplete washing. These cultures were then maintained by feeding with 5 mM glucose media until DIV 6. The neuronal cultures were then transfected with Mito-DsRed and GFP on DIV 6, at which time glucose was reduced to 1 mM. On DIV 9, the neurons were treated with 5 µM LatA or DMSO (vehicle control [Veh]) 2 h before being subjected to a glucose shift. Mitochondrial motility was quantified 2 h after the glucose shift. Glucose levels in the media were measured before every feeding or transfection and are marked with dotted vertical lines. (B) Mitochondrial motility in response to a glucose shift in neurons pretreated with LatA or vehicle control, as schematized in A. For each condition, representative images of axons (top), mitochondria (middle), and kymographs of mitochondrial motility (bottom) are shown and correspond to Video 1. Scale bars represent 20 µm (horizontal) and 30 s (vertical). Here and throughout, kymographs and axon segments are oriented such that rightward movement is toward the axon terminal. (C) Quantification of mitochondrial motility (each data point represents the average percentage of time spent in motion by all mitochondria in an axon segment) from kymographs such as those in B; n = 15–20 axons per condition from 3 independent animals. (D) Mitochondrial motility in neurons expressing GFP-2A-OGT with or without 4-h exposure to 5 µM LatA or DMSO (vehicle control) before imaging. Representative images as in B. Horizontal scale bars represent 20 µm, and vertical scale bars represent 30 s. (E) Quantification of mitochondrial motility from kymographs as in D; n = 15–20 axons per condition from 3 independent animals. Glucose measurements in A are represented as the mean of three measurements, with whiskers indicating SEM. All motility quantifications (C and E) are represented as box-and-whisker plots. The line indicates the median, the box indicates the interquartile range, and whiskers indicate the 10th and 90th percentiles. Outliers are represented as individual dots and were included in all statistical calculations. All P values were calculated from two-tailed unpaired t tests with Welch’s correction.

