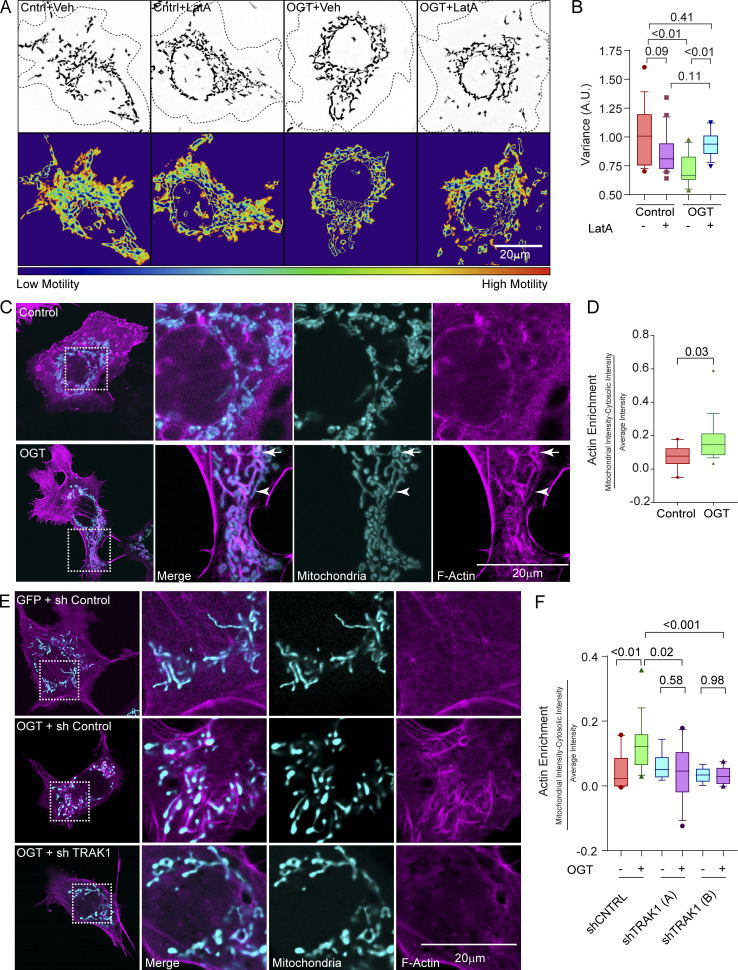
Figure 2.
OGT expression results in F-actin accumulation around mitochondria. (A) Mitochondrial motility in COS-7 cells expressing OGT or a control plasmid (GFP; Cntrl) after treatment with 0.05 µM LatA or its vehicle (DMSO; Veh) for 90 min. Upper panels show representative images of mitochondria in outlined cells. Lower panels show heatmaps of the variance in pixel occupancy (of Mito-DsRed) over time. (B) Quantification of mitochondrial motility from cells as in A, as reflected in the variance heatmaps. n = 15–20 cells per condition from 3 independent transfections. (C and D) Enrichment of F-actin on mitochondria in COS-7 cells expressing GFP-2A-OGT, the F-actin marker LifeAct-RFPt (magenta), and the mitochondrial marker Mito-BFP (cyan). In representative images (C), some mitochondria appear encapsulated by actin (arrow), whereas others align with actin bundles (arrowhead). For quantification (D), F-actin intensity was calculated within the area of a mask formed from the mitochondrial signal and then dilated by 2 pixels (to include the F-actin–enriched area around the mitochondria). This intensity was then normalized to the total amount of F-actin within the cell. n = 10–15 cells per condition from 3 independent transfections. (E and F) shRNA to TRAK1 prevents the enrichment of F-actin on mitochondria in COS-7 cells expressing GFP-2A-OGT. (E) Representative images of cells expressing the F-actin marker F-Tractin-RFP (magenta) and the mitochondrial marker Mito-BFP (cyan). GFP-2A-OGT increases F-actin accumulation around mitochondria in the presence of a control shRNA but not in the presence of two unique shRNAs to TRAK1. Quantification in F is as in D. n = 10–15 cells per condition from 3 independent transfections. All quantifications are represented as box-and-whisker plots. The line indicates the median, the box indicates the interquartile range, and whiskers indicate the 10th and 90th percentiles. Outliers are represented as individual dots and are included in all statistical calculations. The indicated P values are from the two-tailed unpaired t test in which Welch’s correction was used.

