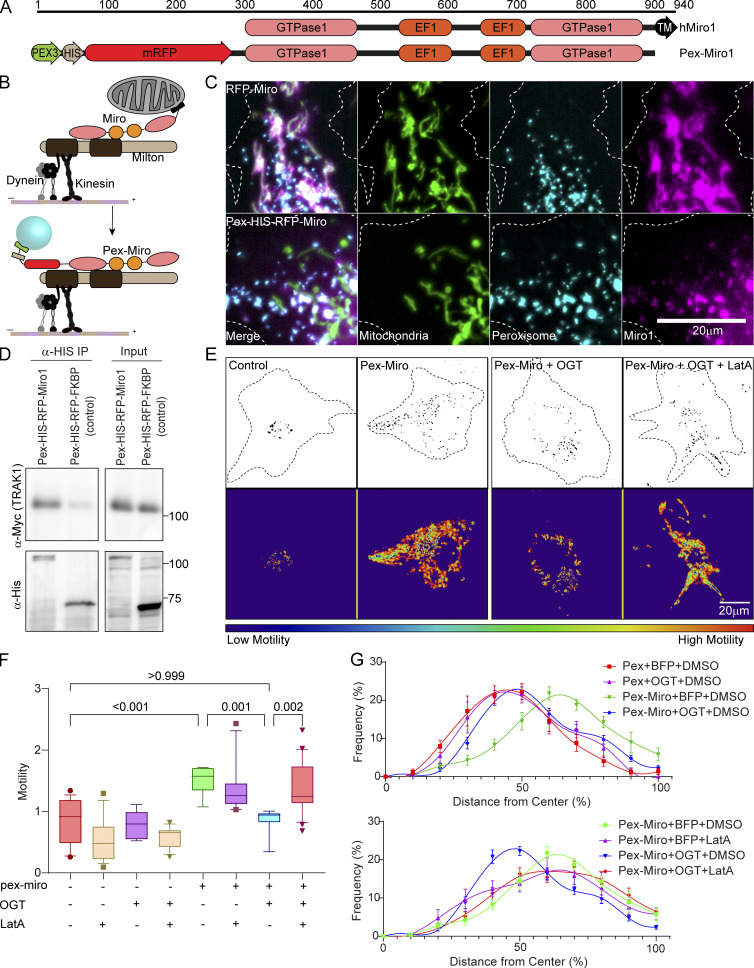
Figure 3.
Mislocalizing the mitochondrial motor–adaptor complex to peroxisomes is sufficient to make peroxisomal motility subject to regulation by OGT and F-actin. (A and B) Schematic of redirecting the TRAK1–Miro complex onto peroxisomes. (A) The transmembrane domain (N-terminal 44-aa residues) of a peroxisomal membrane protein (Pex3) was attached to the N-terminus of Miro1 (first 592 aa residues) lacking its own transmembrane domain. (B) In consequence, the complex assembles on the peroxisomal surface. (C) Representative images of cells demonstrating the localization of Pex-Miro to peroxisomes. The cells have been transfected with the mitochondrial marker Mito-BFP and the peroxisomal marker mCitrine-SKL in addition to RFP-tagged full-length Miro or Pex-Miro. Full-length WT Miro1 localized to mitochondria (upper panels), whereas Pex-Miro localized to peroxisomes (lower panels). (D) Myc-TRAK1 association with Pex-Miro. Pex-Miro (mol wt 105 kD) or Pex-FKBP (control; mol wt 60 kD) were immunoprecipitated by their 6XHis tags from HEK293T cells also expressing Myc-TRAK1. Immunoprecipitates were probed for His and Myc immunoreactivity to detect the Pex constructs and TRAK1. Molecular weights (in kD) are indicated on the right. (E–G) Expression of Pex-Miro conveys OGT regulation on the motility and dispersion of peroxisomes. COS-7 cells were transfected with BFP-2A-OGT or BFP (control) in addition to Pex-Miro or Pex-FKBP. The cells were also treated with 0.05 µM LatA or DMSO (control). Time-lapse images from these cells were quantified by variance analysis using the same software used for quantifying mitochondrial motility in COS-7 cells. (E) Representative images of the peroxisomes (upper panels) and a heatmap of the variance (lower panels) are shown and correspond to Video 6. (F) Quantification of peroxisomal motility from variance images as shown in E. Higher motility of peroxisomes yielded a higher variance signal in the cells expressing Pex-Miro. This was significantly reduced when BFP-2A-OGT was expressed in these cells. On treatment with LatA, the OGT-mediated arrest of Pex-Miro peroxisomes was reversed, thereby demonstrating the role of F-actin to bring about the arrest. (G) Quantification of peroxisomal distribution in COS-7 cells expressing constructs as in E. The distribution quantification was done by custom software that analyzes their distribution as a function of distance from the cell center, normalized for cell shape. Peroxisomes in control cells are close to the cell center but are broadly distributed in cells expressing Pex-Miro. Expression of OGT reduces peroxisomal dispersion, but this reduction is reversed by LatA. n = 15–21 cells per condition from 3 independent transfections. The data from the conditions Pex-Miro + BFP + DMSO and Pex-Miro + OGT + DMSO have been replicated in both panels for ease of comparison with the other datasets. For calculating peroxisomal distributions, each cell was divided into 10 shells, each representing 10% growth from the cell center. Peroxisomal frequencies are represented as the relative percentage of peroxisomes at each concentric shell. Each point indicates the means of all cells, and the whiskers indicate SEM. The motility quantifications in F are represented as box-and-whisker plots. The line indicates the median, the box indicates the interquartile range, and whiskers indicate the 10th and 90th percentiles. Outliers are represented as individual dots and are included in all statistical calculations. A two-tailed unpaired t test with Welch’s correction was used to generate the indicated P values.

