Figure 5.
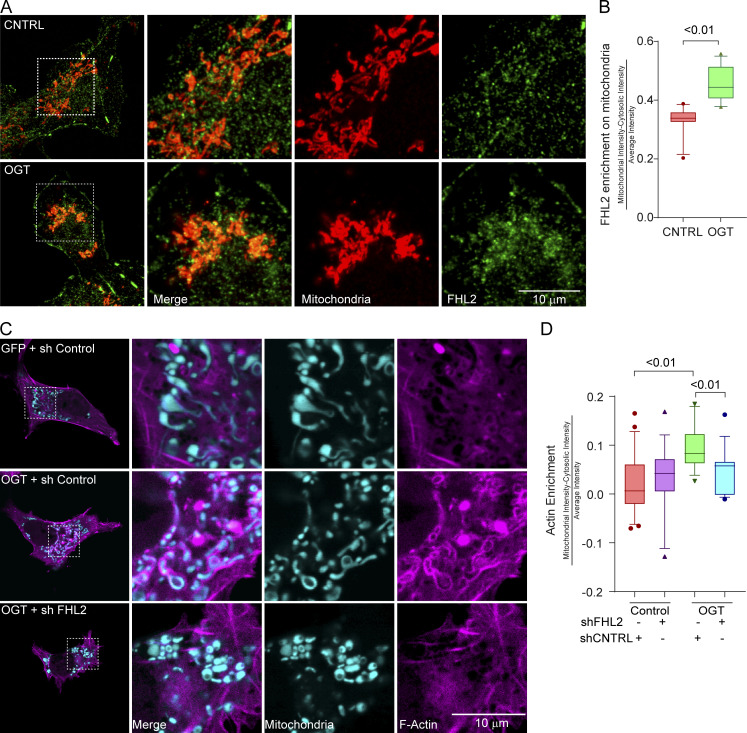
FHL2 accumulation on mitochondria is necessary for OGT-induced mitochondrial recruitment of F-actin. (A) FHL2 enrichment on mitochondria in COS-7 cells expressing OGT. COS-7 cells expressing GFP-2A-OGT or a control (CNTRL) GFP plasmid were fixed and probed with antibodies against FHL2 (green) and mitochondria (ATP5A, red). Full cells (left) and enlargements (right) of the indicated regions are shown. (B) Quantification of FHL2 enrichment on mitochondria in cells as in A. The enrichment of FHL2 on mitochondria was quantified as the intensity of the FHL2 in the mitochondrial mask normalized to the average intensity of FHL2 in the cytosol. n = 10–15 cells per condition from 3 independent transfections. (C and D) Mitochondrial F-actin enrichment in COS-7 cells expressing GFP-2A-OGT is dependent on FHL2. (C) Representative images, full cells (left panels), and enlarged regions of cells expressing the F-actin marker F-Tractin-RFP (magenta) and the mitochondrial marker Mito-BFP (cyan) along with GFP-2A-OGT or GFP (control). (D) Quantifications of F-actin enrichment around mitochondria were done as described for Fig. 2. When FHL2 is knocked down (shFHL2), the OGT-mediated increase of F-actin around mitochondria is prevented. n = 10–15 cells per condition from 3 independent transfections. Data are represented as box-and-whisker plots. The line indicates the median, the box indicates interquartile range, and whiskers indicate the 10th and 90th percentiles. Outliers are represented as individual dots and are included in all statistical calculations. For significance testing, a two-tailed unpaired t test with Welch’s correction was used, and P values are indicated.

