Figure 7.
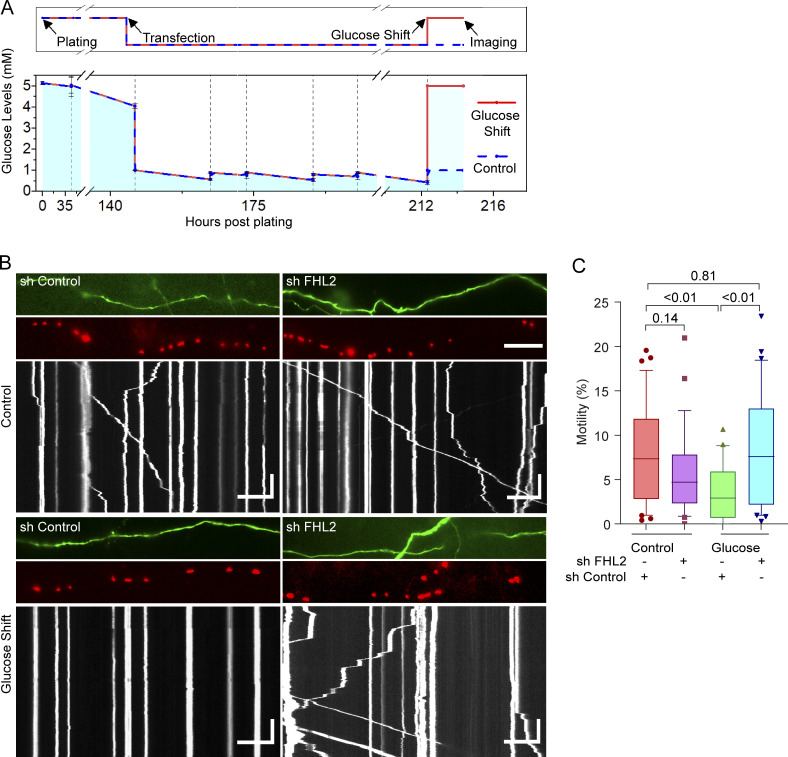
Glucose-mediated mitochondrial arrest requires FHL2. (A) Schematic of experimental timeline (top) and measured glucose levels (bottom). Neurons were maintained at 5 mM glucose until DIV6, transfected, and then grown in 1 mM glucose. After 72 h, the glucose levels were either shifted back to 5 mM (glucose shift) or maintained in 1 mM (control) and imaged 2 h later. Glucose levels were measured before and after every feeding. n = 3 biological replicates, and mean and SEM are shown. (B and C) Neurons, cultured as in A, were transfected with shRNA against FHL2 or a nontargeting control shRNA, in addition to Mito-DsRed and GFP. (B) Images and kymographs of mitochondrial motility in neurons transfected as indicated (corresponding to Video 7). Horizontal scale bars represent 20 µm, and vertical scale bars represent 30 s. (C) Quantification of the percentage motility from kymographs as in B. The glucose shift did not decrease motility in neurons expressing FHL2 shRNA. n = 27–30 axons per condition from 4 independent animals. All quantifications are represented as box-and-whisker plots. The line indicates the median, the box indicates interquartile range, and whiskers indicate the 10th and 90th percentiles. Outliers are represented as individual dots and are included in all statistical calculations. The indicated P values are from two-tailed unpaired t tests with Welch’s correction.

