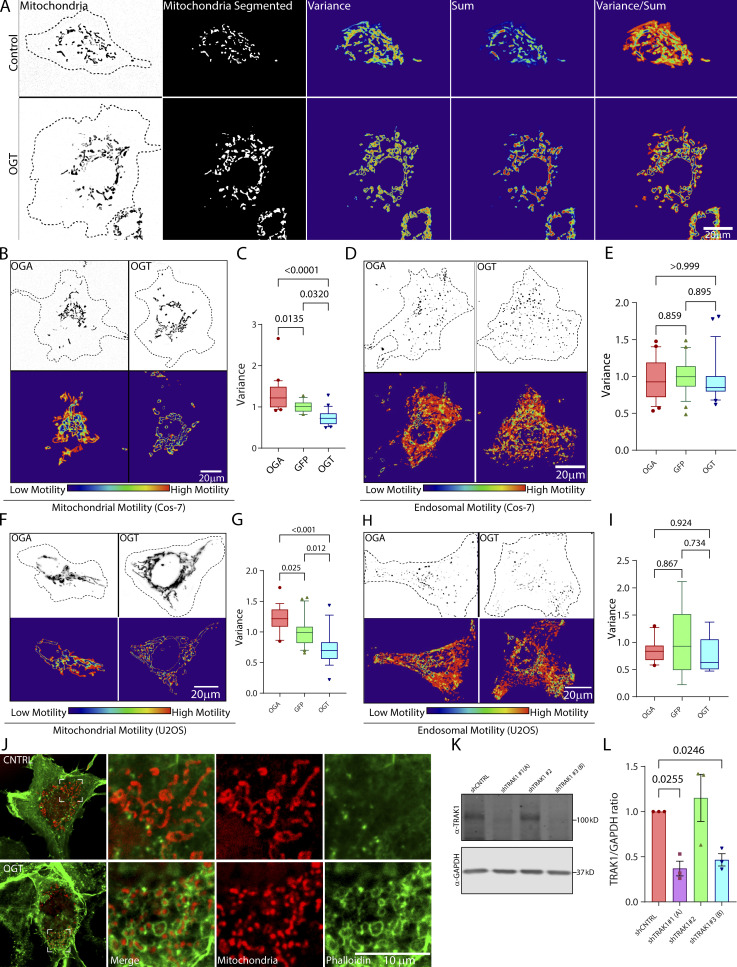
Figure S2.
OGT suppresses mitochondrial motility in COS-7 and U2OS cells (related to Fig. 2). (A) Stages in the quantification of mitochondrial motility in non-neuronal cells, exemplified by representative COS-7 cells with high motility (control) and low motility (OGT expressing; for corresponding movie, see Video 2). The mitochondria are initially defined by a threshold that is based on the contrast of the fluorescence signal over the local background. This thresholding makes the measurement independent of the differences in the real fluorescence of the mitochondria. To eliminate noise from individual pixels, a lower size limit for a mitochondrion is also defined. After this segmentation step, the variance and the sum of fluorescence over time for each pixel are then calculated. The final motility heatmap is constructed as the ratio of variance over sum. Parts of the image that have high and processive movement display high variance and low sum and thereby appear as hot spots in the heatmap. To derive a motility value from such a heatmap, the sum of the values for all the pixels is normalized to the area occupied by the mitochondria. See Materials and methods for details. (B and C) Upon overexpression, OGT increases O-GlcNAcylation and decreases mitochondrial motility, whereas OGA decreases O-GlcNAcylation and increases mitochondrial motility. To monitor mitochondrial motility, COS-7 cells were transfected with Mito-DsRed along with GFP-2A-OGT or GFP-2A-HA-OGA or control (GFP) constructs. (B) Representative images of mitochondria in each outlined cell (top) and a heatmap for each cell of the variance in mitochondrial fluorescence over time (bottom; corresponds to Video 3). (C) Quantification of mitochondrial motility for cells such as those in B, as illustrated in A. n = 15–20 cells per condition from 3 independent transfections. (D and E) OGT and OGA constructs do not influence endosomal motility. COS-7 cells were cotransfected with Rab5-mCherry to label endosomes, along with GFP-2A-OGT or GFP-2A-HA-OGA or GFP and analyzed as in C. Representative images (D) and quantification of motility (E; similar cells expressing OGA and OGT are shown in Video 5). n = 15–20 cells per condition from 3 independent transfections. (F and G) In U2OS cells, OGT and OGA alter mitochondrial motility as they do in COS-7 cells. (F) Representative images of U2OS cells expressing Mito-DsRed and OGT or OGA are shown along with their variance heatmap. (G) Quantification of mitochondrial movement in the U2OS cells was done in the same manner as described for COS-7 cells. n = 10–15 cells per condition from 3 independent transfections. (H and I) OGT and OGA constructs do not influence endosomal motility in U2OS cells. U2OS cells were cotransfected with Rab5-mCherry to label endosomes, along with GFP-2A-OGT or GFP-2A-HA-OGA or GFP (control) and analyzed as before. (H) Representative images of endosomes and their heatmaps are shown. (I) Quantification of endosomal motility was done by measuring the variance of pixel occupancy as described in A. Neither OGA nor OGT changed the endosomal motility significantly from that observed for the cells expressing GFP (control; I). n = 10–15 cells per condition from 3 independent transfections. (J) Enrichment of phalloidin-labeled F-actin around mitochondria upon expression of OGT. Cells expressing OGT or GFP (control) were fixed and stained with phalloidin and an antibody against ATP5A. As seen with other F-actin markers (LifeAct-RFPt and F-Tractin), phalloidin staining revealed dense F-actin networks around mitochondria in the cells expressing OGT. (K and L) Validation of shRNA against TRAK1 in COS-7 cells. COS-7 cells were transfected with three different shRNA sequences against TRAK1 (shTRAK1 1–3) and a nontargeting control shRNA. Cell lysates were probed for TRAK1 to determine the efficiency of knockdown. (K) Representative Western blot. Molecular weights (in kD) are indicated on the right. (L) Quantification of TRAK1 knockdown from Western blots as in K. The intensity of the TRAK1 band was normalized to the intensity of the GAPDH band. Two shRNAs were effective at reducing TRAK1 levels and were chosen as shTRAK1 (A) and shTRAK1 (B). n = 3 independent transfections per condition. Quantifications in C, E, G, and I are represented as box-and-whisker plots. The line indicates the median, the box indicates the interquartile range, and whiskers indicate the 10th and 90th percentiles. Outliers are represented as individual dots and are included in all statistical calculations. P values were determined with a two-tailed unpaired t test with Welch’s correction. In L, bars indicate mean ± SEM, and a ratio paired t test was employed to calculate P values.

