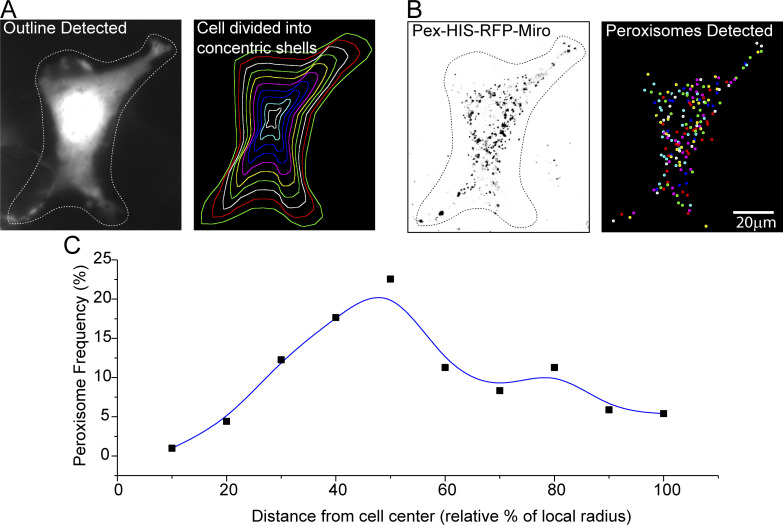
Figure S3.
Quantification of peroxisomal distribution in COS-7 cells (related to Fig. 3). (A) Division of the cell into concentric shells. The cell outline is automatically detected from fluorescence intensity above a defined global threshold. The outline can then be manually refined. A user-defined cell center is then selected; for these studies, it was placed in the center of the nucleus. The distance of each point on the cell outline to the cell center is calculated using a path that does not go outside the cell outline. These values are used to make equally spaced concentric shells that are parallel to the cell outline. As illustrated here, 10 shells were used for each cell in this study. (B) The peroxisomes are detected based on their intensity over their local background and with upper and lower size limits to eliminate pixel noise. (C) Representative graph showing the frequency of peroxisomal occurrence in each shell of the cell illustrated in A and B. The average of multiple such frequency histograms from different cells was used to quantify each condition depicted in Fig. 3 G.

