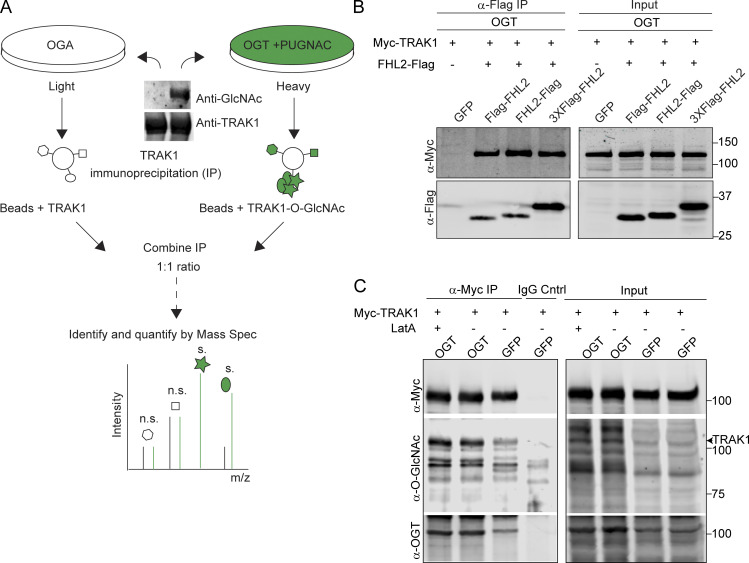
Figure S4.
Identification of FHL2 as an interactor of O-GlcNAcylated TRAK1 (related to Fig. 4). (A) Schematic for TRAK1 interactome analysis by SILAC-based quantitative proteomics. HEK293T cells expressing either OGA or OGT were cultured through five doublings in media containing L-arginine and L-lysine made of heavy and light C and N isotopes. OGT-expressing cells were cultured in the presence of the OGA inhibitor PUGNAc (100 µM). Cells were then immunoprecipitated with 2 μg of anti-TRAK1 antibody. A Western blot of the precipitate probed for TRAK1 and O-GlcNAc is shown and illustrates the differences in the extent of TRAK1 O-GlcNAcylation in the two conditions. The immunoprecipitates were then combined in a 1:1 ratio to ensure equal amounts of immunoprecipitated TRAK1 and interactors were quantified using mass spectrometry (Mass Spec). m/z, mass-to-charge ratio. (B) TRAK1 binds to Flag-tagged FHL2 in OGT-expressing cells. HEK293T cells were cotransfected with OGT, Myc-TRAK1, and one of three Flag-tagged FHL2 constructs (FHL2-Flag, Flag-FHL2, 3XFlag-FHL2) or GFP as a control. A representative Western blot is shown for the IP with anti-Flag antibody and subsequent probing with anti-Flag and anti-Myc. FHL2-Flag was most effective in immunoprecipitating TRAK1 and was chosen for further experiments. (C) LatA treatment does not change O-GlcNAcylation levels on TRAK1. HEK293T cells expressing OGT or GFP (control) along with Myc-TRAK1 were treated with 0.05 μM LatA or DMSO (control). Myc-TRAK1 was then immunoprecipitated from these cells and probed for levels of O-GlcNAcylation on a Western blot. Myc-TRAK1 immunoprecipitated from cells expressing OGT show higher levels of O-GlcNAcylation than control cells. This difference persisted in the presence of LatA. The TRAK1 band is indicated with an arrowhead. For panels showing Western blots, molecular weights (in kD) are indicated on the right.

