Figure S6.
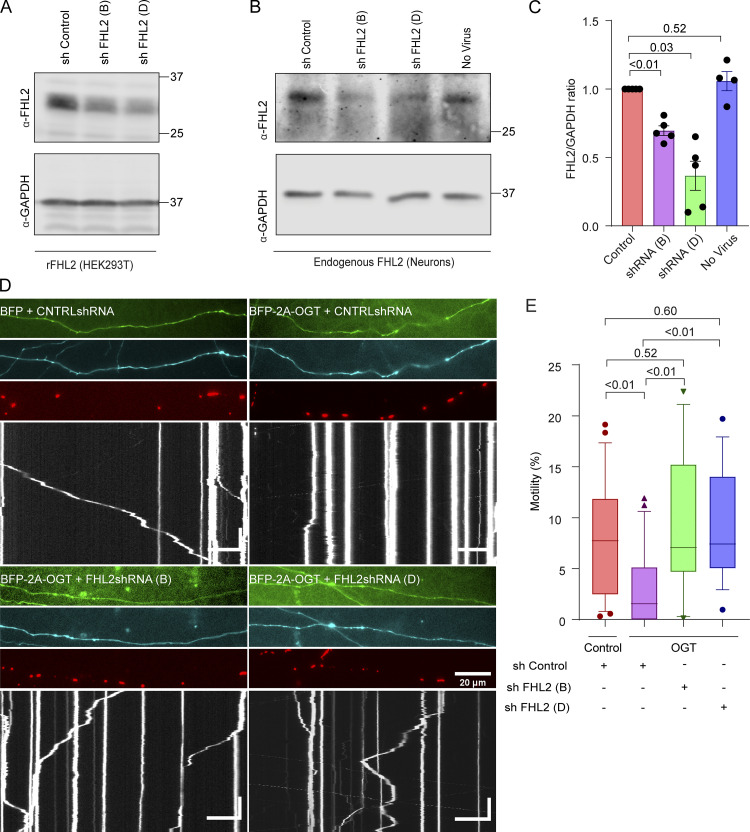
Knockdown of FHL2 prevents OGT-mediated mitochondrial arrest (related to Fig. 6). (A) Validation of shRNA sequences against rat (r)FHL2 in HEK293T cells transfected with a rat FHL2 overexpression vector and the indicated shRNA constructs. On Western blots probed for FHL2 and GAPDH (as a loading control), shRNA B and shRNA D (out of a set of four shRNA constructs tested) potently reduced FHL2 levels. (B and C) Validation of knockdown of endogenous neuronal FHL2 by shRNA. At DIV 1, neurons were transduced with lentiviruses encoding shRNA constructs B and D or a control construct. (B) Representative Western blot of neuronal lysates harvested on DIV 6 and probed for FHL2 and GAPDH. (C) Knockdown efficiency was quantified as the ratio of the intensity of FHL2 bands to that of GAPDH and normalized to the control shRNA. n = 5 independent transductions per condition. P values are from ratio paired t tests, and all data points are shown. Bars indicate mean ± SEM. (D and E) Mitochondria in OGT-expressing neurons remain motile if FHL2 shRNA is also expressed using constructs distinct from those in Fig. 6. Hippocampal neurons were transfected with Mito-DsRed, BFP-2A-OGT or BFP (control), and shRNA against FHL2 or a control nontargeting shRNA. A GFP expression cassette in the shRNA vector backbone reported expression levels of shRNA. (D) Representative axonal images of shRNA expression (green), OGT expression (cyan), mitochondria (red), and kymographs constructed from the mitochondrial channel (bottom). (E) Quantification of mitochondrial motility from kymographs as in D. n = 15–20 axons per condition from 3 independent animals. Horizontal scale bars represent 20 µm, and vertical scale bars represent 30 s. OGT expression suppresses mitochondrial motility in the presence of the control shRNA. However, in the presence of either FHL2 shRNA construct, mitochondrial motility was unimpaired by OGT. Data are represented as box-and-whisker plot. The line indicates the median, the box indicates the interquartile range, and whiskers indicate the 10th and 90th percentiles. Outliers are represented as individual dots and are included in all statistical calculations. P values are from two-tailed unpaired t tests with Welch’s correction. For panels showing Western blots, molecular weights (in kD) are indicated on the right.

