Figure S7.
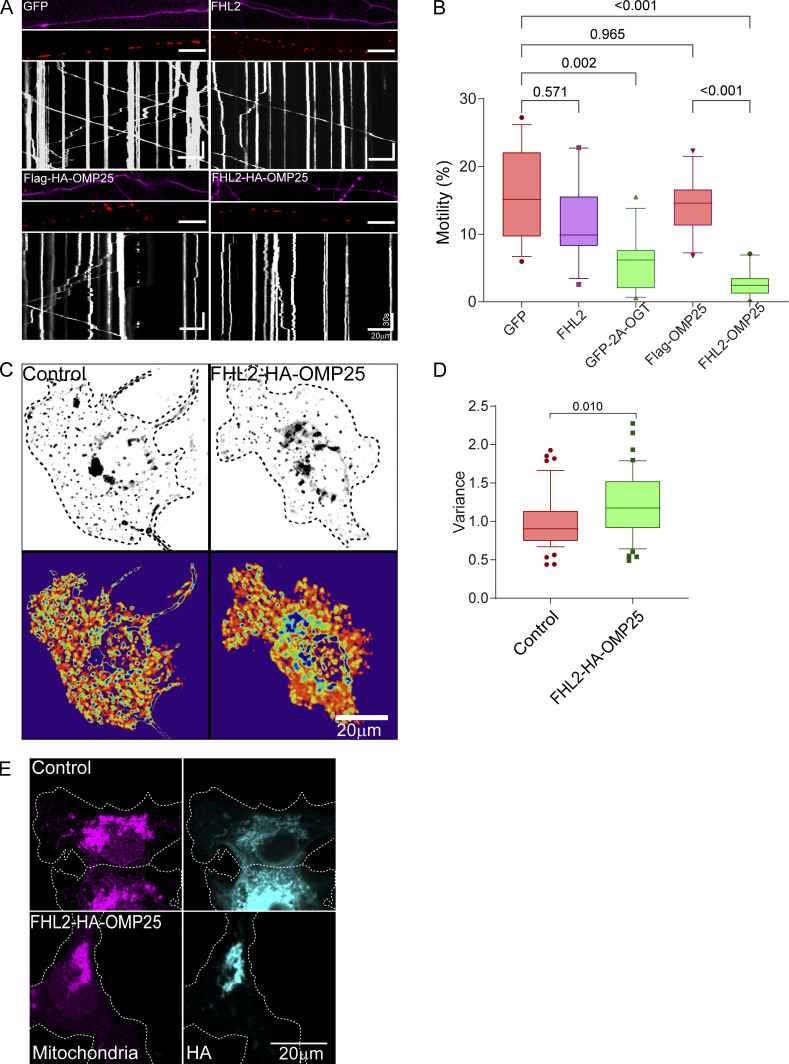
FHL2-HA-OMP25 expression in neurons and COS-7 cells (related to Fig. 8). (A and B) Mito-FHL2 (FHL2-OMP25) inhibits mitochondrial motility in neurons, whereas cytosolic FHL2 does not. Hippocampal neurons were transfected with FHL2, FHL2-HA-OMP25, GFP-2A-OGT, GFP (control), or Flag-HA-OMP25 (control) along with Mito-DsRed. (A) Representative axonal images of FHL2 or OGT expression (magenta), mitochondria (red), and kymographs constructed from the mitochondrial channel (bottom). (B) Quantification of mitochondrial motility (average percentage of time spent in motion by all mitochondria in an axon segment) from kymographs shown in A. Although FHL2-HA-OMP25 and OGT significantly reduce mitochondrial motility, the expression of cytosolic FHL2 does not. n = 15–20 cells per condition from 3 independent animals. Horizontal scale bars represent 20 µm, and vertical scale bars represent 30 s. (C and D) Endosomal motility in COS-7 cells was not inhibited by expression of FHL2-HA-OMP25. FHL2-HA-OMP25 or FLAG-HA-OMP25 (control) were expressed together with Rab5-mEmerald. (C) Representative images of endosomes (top) and heatmap of variance representing endosomal motility (bottom). (D) Motility was quantified from the variance and normalized to the control cells. n = 40–45 cells per condition from 3 independent transfections. The quantifications in B and D are represented as box-and-whisker plots. The line indicates the median, the box indicates the interquartile range, and whiskers indicate the 10th and 90th percentiles. Outliers are represented as individual dots and are included in all statistical calculations. P values are from a two-tailed unpaired t test with Welch’s correction. (E) Mitochondrial localization of FHL2-HA-OMP25 and Flag-HA-OMP25. Transfected COS-7 cells were fixed and stained with antibodies to HA and to the mitochondrial protein ATP5A.

