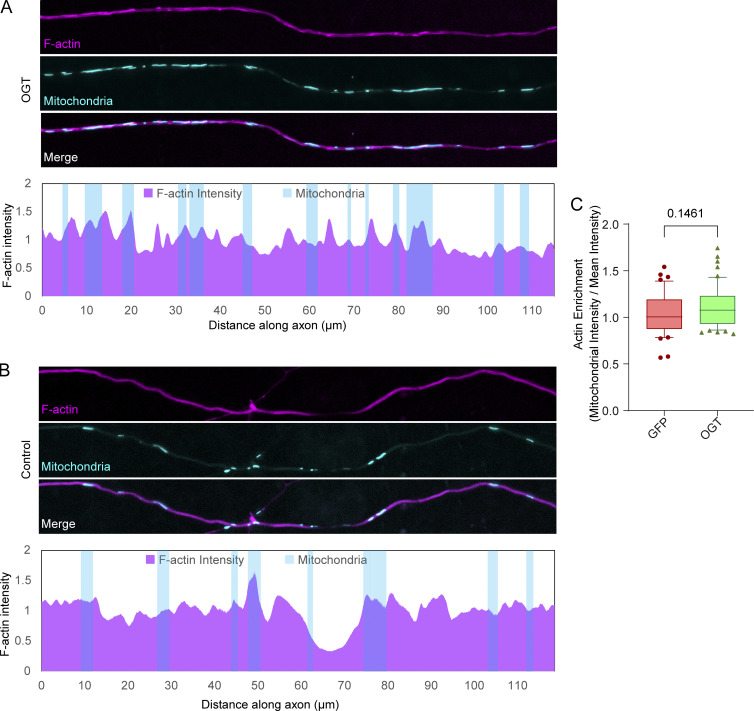
Figure S8.
OGT-mediated arrest in neurons does not require large redistribution of axonal F-actin (related to the Discussion text). (A and B) Neurons were transfected with LifeAct-RFPt (actin marker), OGT or GFP (control), and Mito-BFP. Top: Representative images of LifeAct-RFPt (magenta) and mitochondria (cyan). The F-actin intensity was measured along each axon and normalized to the average intensity in that axon. Bottom: Normalized F-actin intensity (magenta) along the corresponding axons and the locations of mitochondria (cyan). (C) Quantification of F-actin colocalization with mitochondria. To calculate F-actin enrichment, the ratio of F-actin intensity on mitochondria to the mean F-actin intensity (along the axon) was considered. Although there is a trend of increased F-actin on mitochondria in axons expressing OGT, the increase is slight. The quantification is represented as a box-and-whisker plot. The line indicates the median, the box indicates the interquartile range, and whiskers indicate the 10th and 90th percentiles. Outliers are represented as individual dots and are included in all statistical calculations. P values are from a two-tailed unpaired t test with Welch’s correction.

