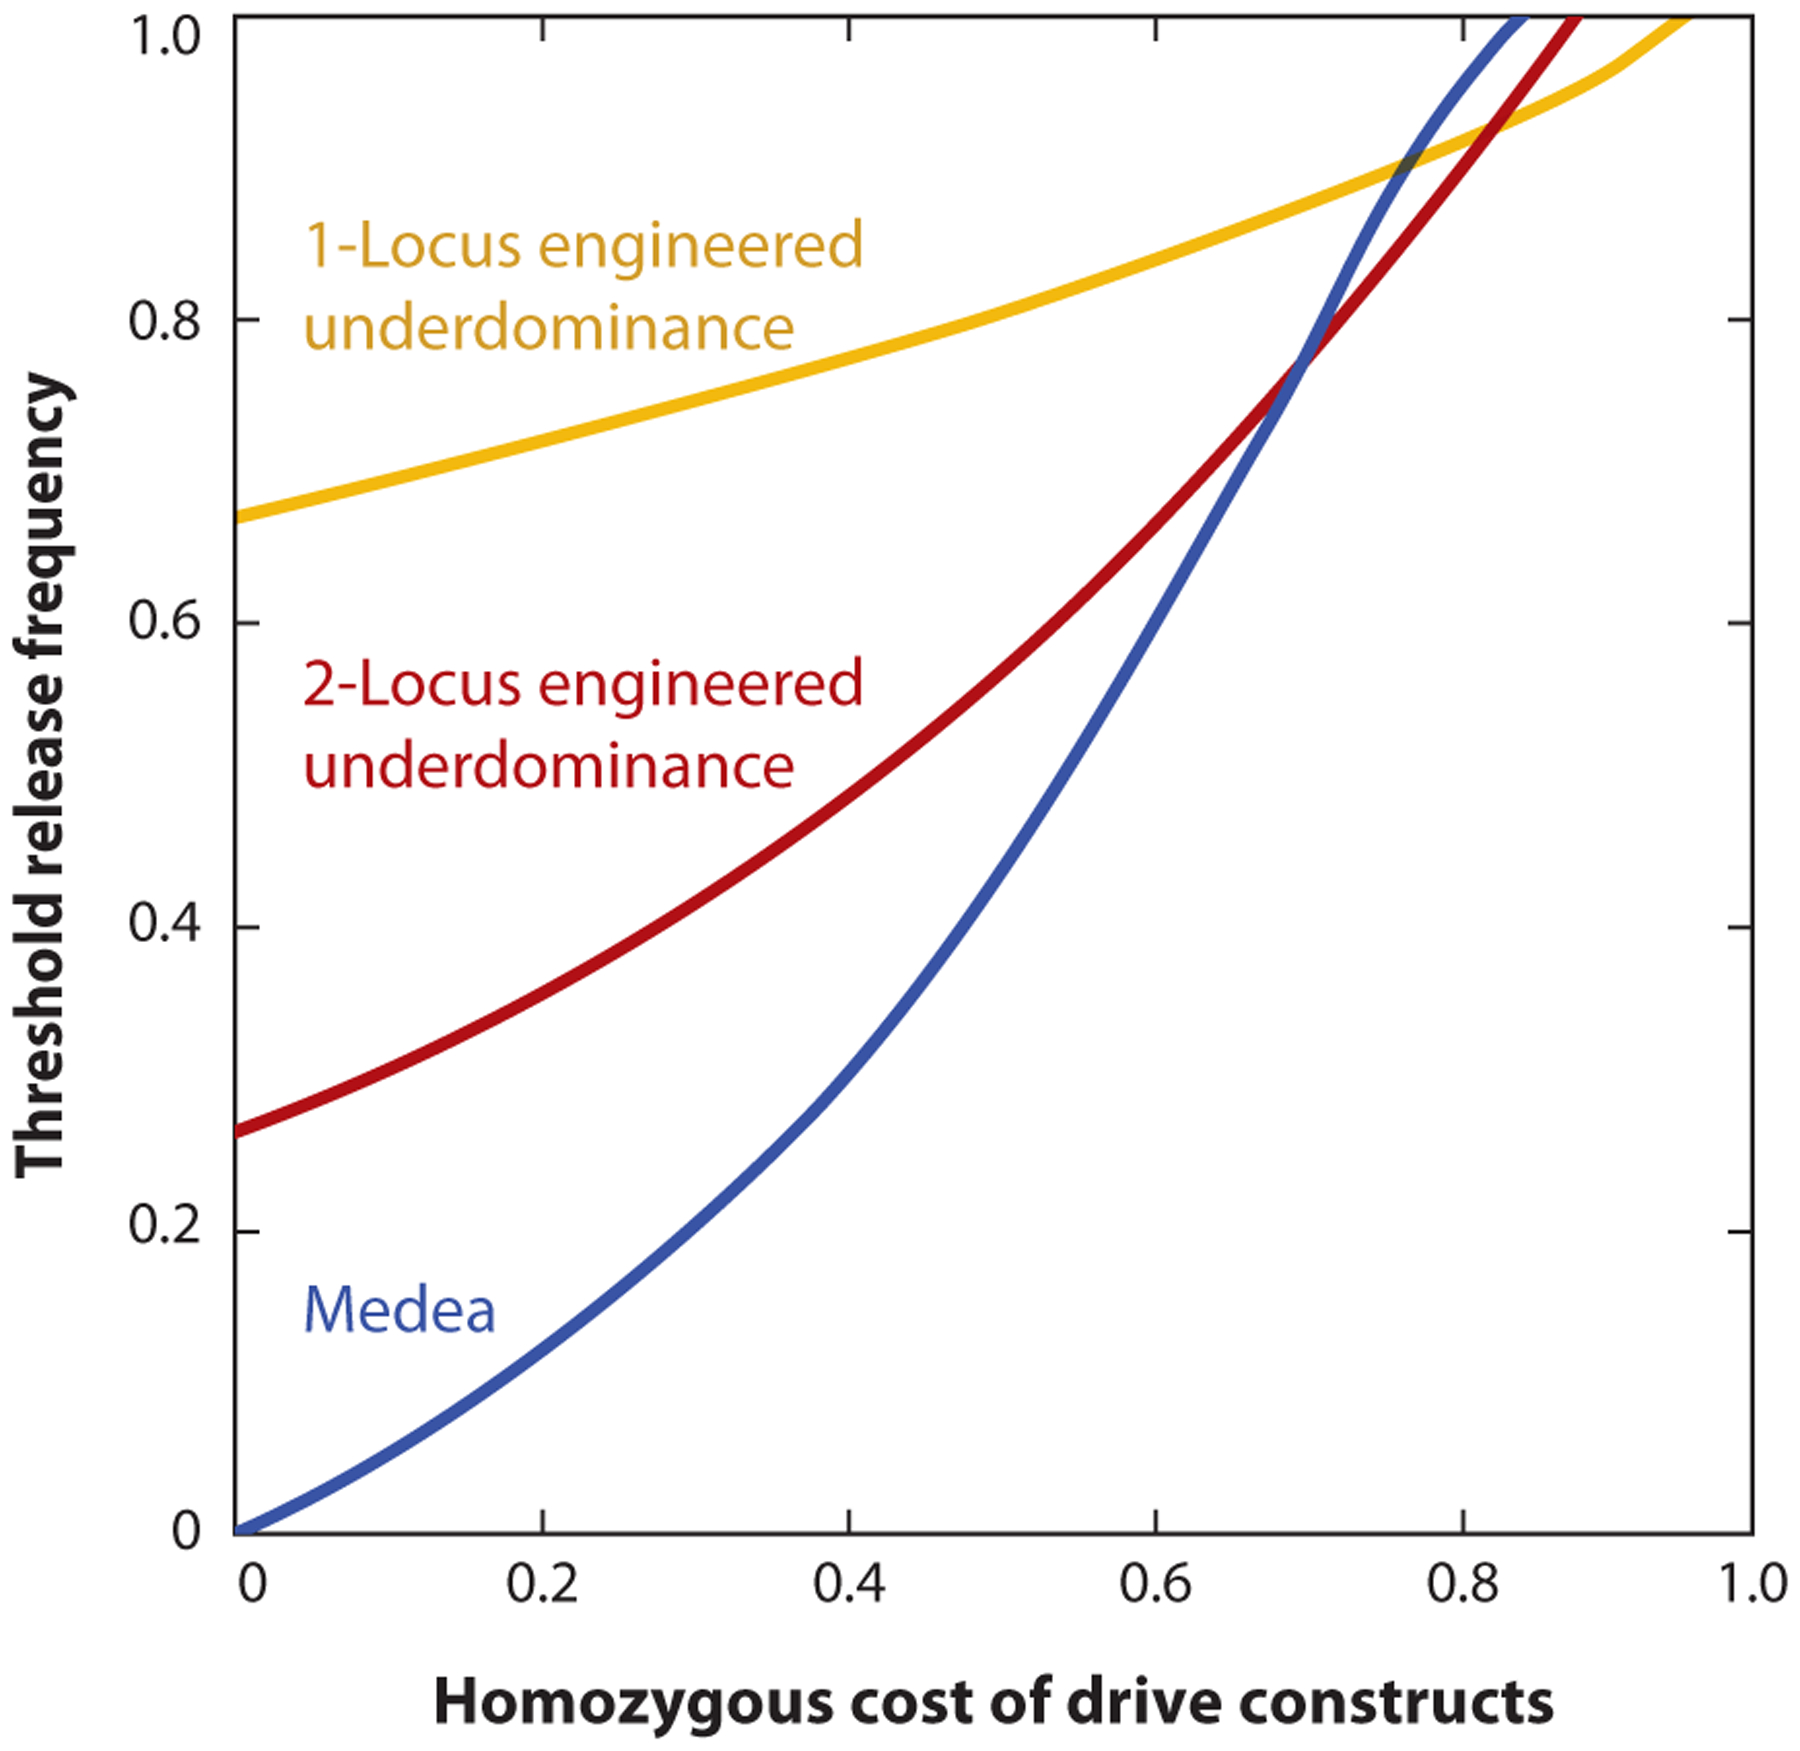
Figure 1.

The threshold release frequency of threshold gene drives increases with the fitness cost imposed by the drive constructs. Shown here are the release thresholds for three gene drives—Medea (blue line), 2-locus engineered underdominance (red line), and 1-locus engineered underdominance (yellow line)—as they vary with the fitness cost incurred by individuals homozygous for the drive constructs.
