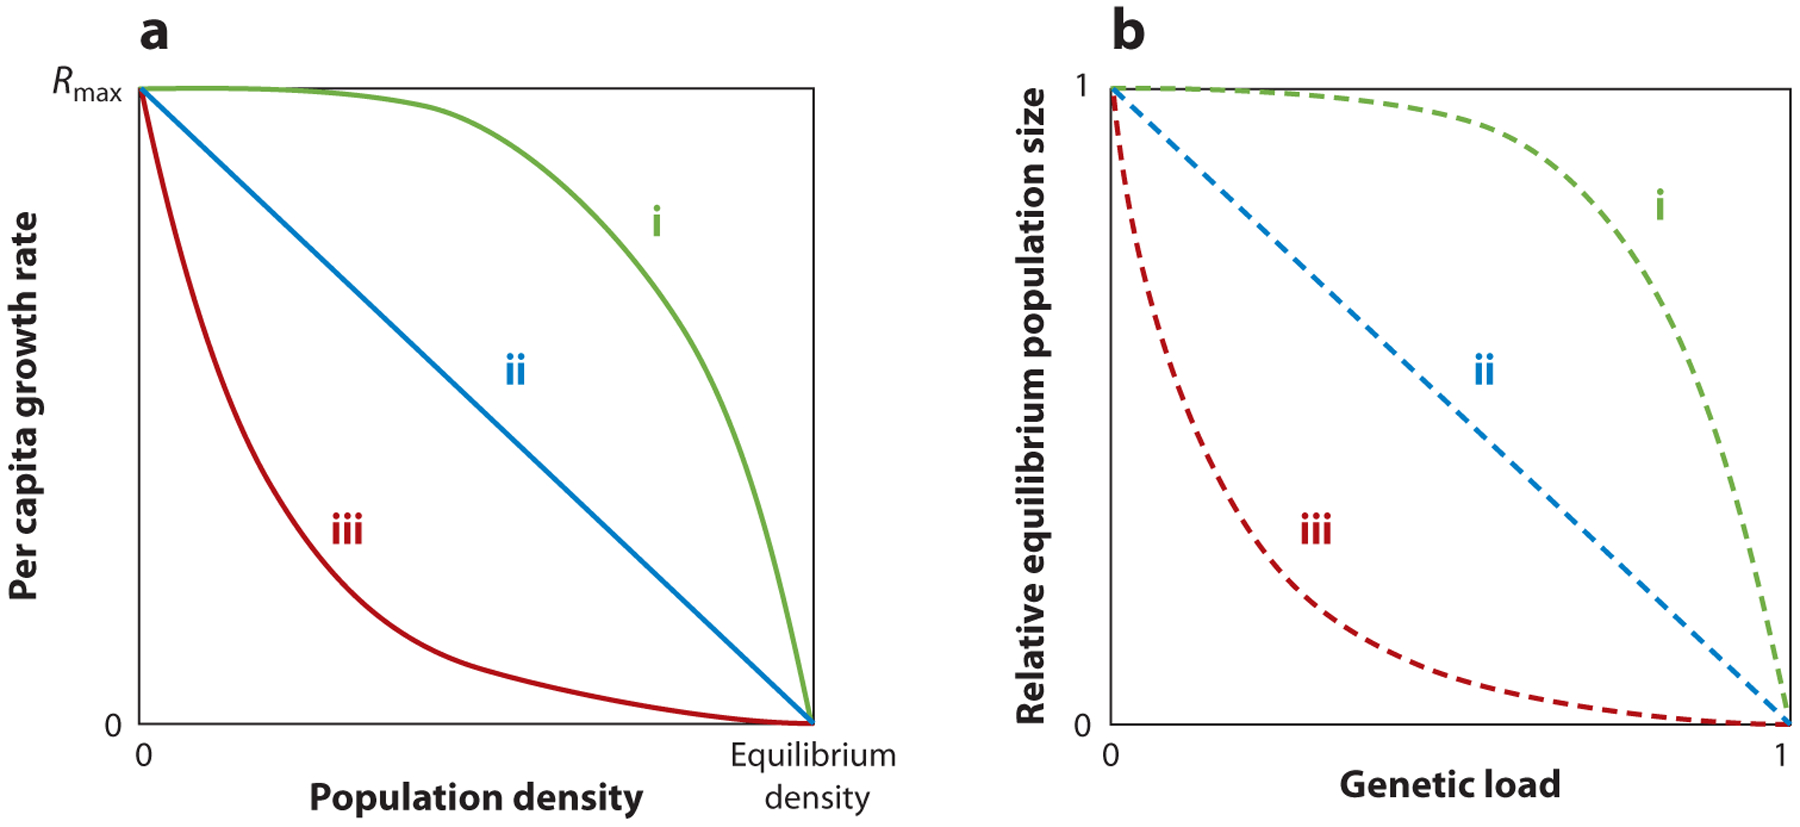
Figure 2.

(a, solid curves) A highly simplified depiction of three forms of density-dependent dynamics is shown, along with (b, dashed curves) corresponding curves for the relative equilibrium population size reached with a given amount of genetic load. Rmax denotes the maximum per capita growth rate at a low density. Equilibrium density refers to the equilibrium population density of a fully wild-type population. In both panels, curve i is an overcompensatory response, curve ii is a linear response (e.g., simple logistic), and curve iii is an undercompensatory response to application of genetic load.
