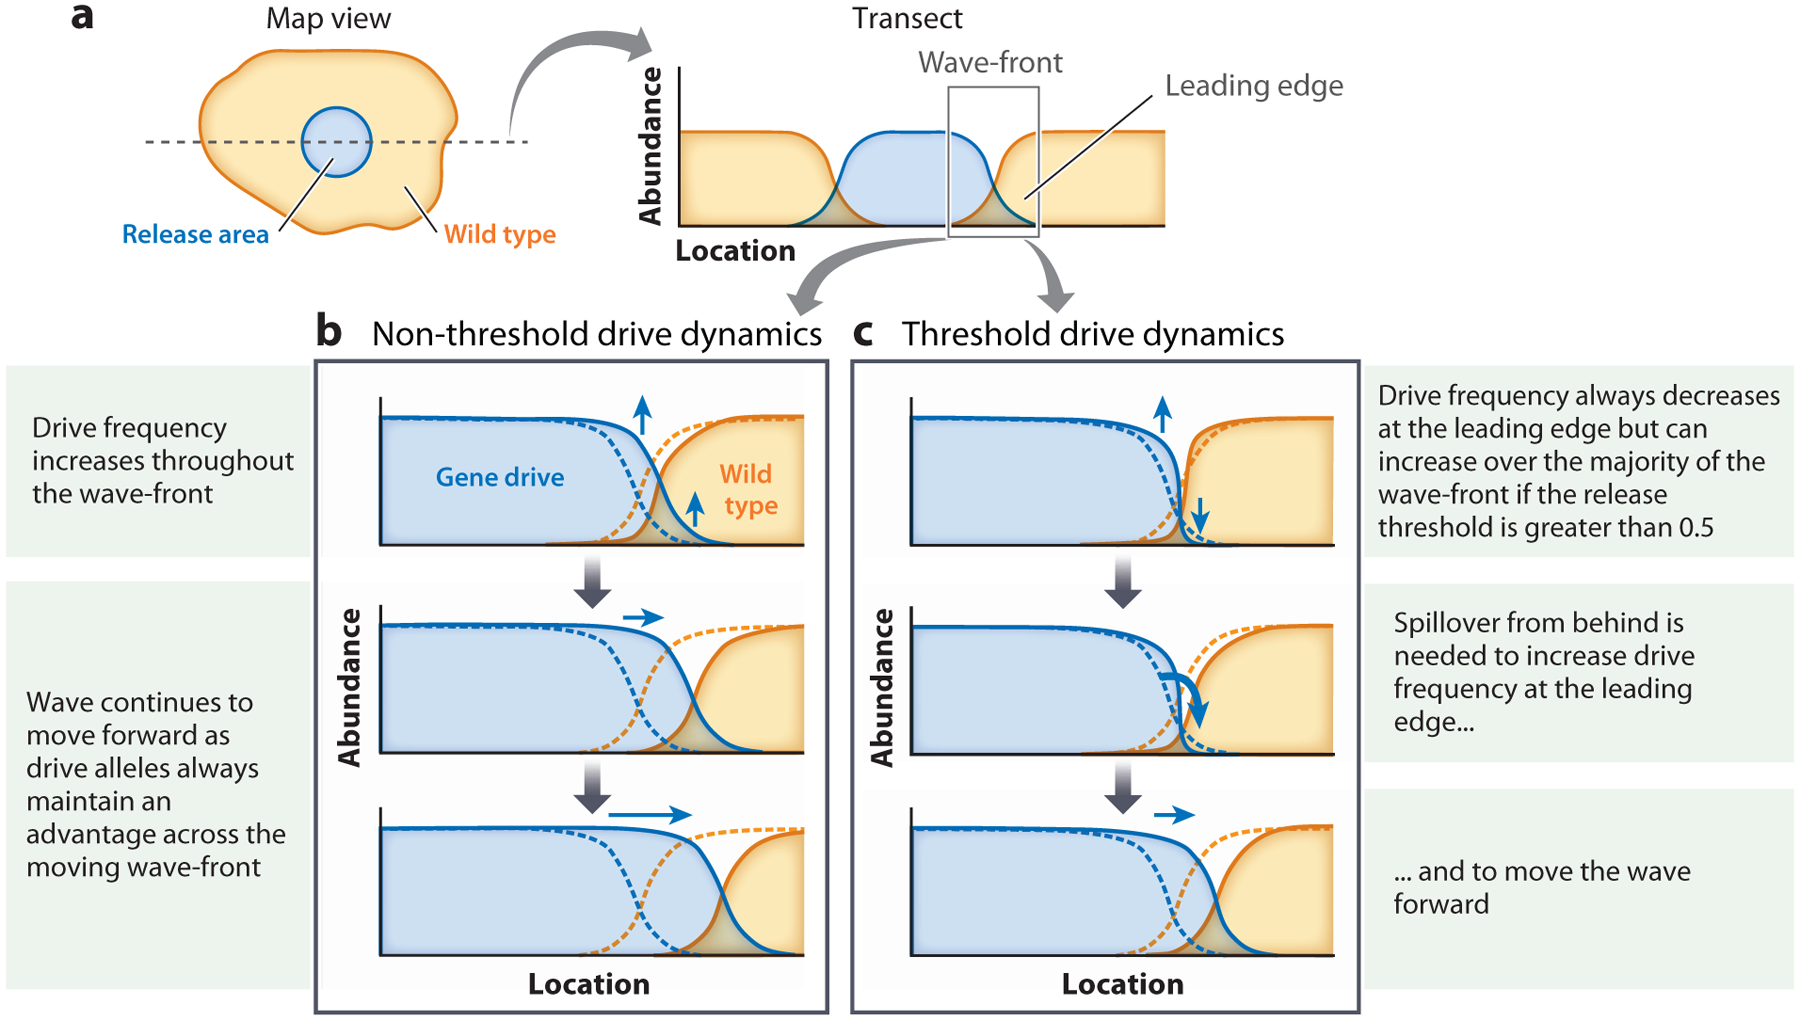
Figure 3.

Fisherian versus Bartonian wave spread. Dynamics are shown after a gene drive (blue) is introduced in a central release area within a wild-type (orange) population. (a) Abundance of wild-type and gene-drive alleles across a transect through the release area is shown after local drive establishment within the release area. Dynamics across a wave-front (region shown by gray box) are shown for two types of gene drive. Original wave positions are shown with dashed curves. (b) As a non-threshold gene drive has a fitness advantage over wild-type genes even at very low frequencies, its abundance increases throughout the wave-front, allowing the drive to spread. (c) The fitness disadvantage faced by a threshold drive when at a low frequency causes a decrease in its local abundance at the leading edge; an influx of drive-carrying individuals into the leading edge from behind is needed to overcompensate for this decrease in order for the gene drive to spread.
