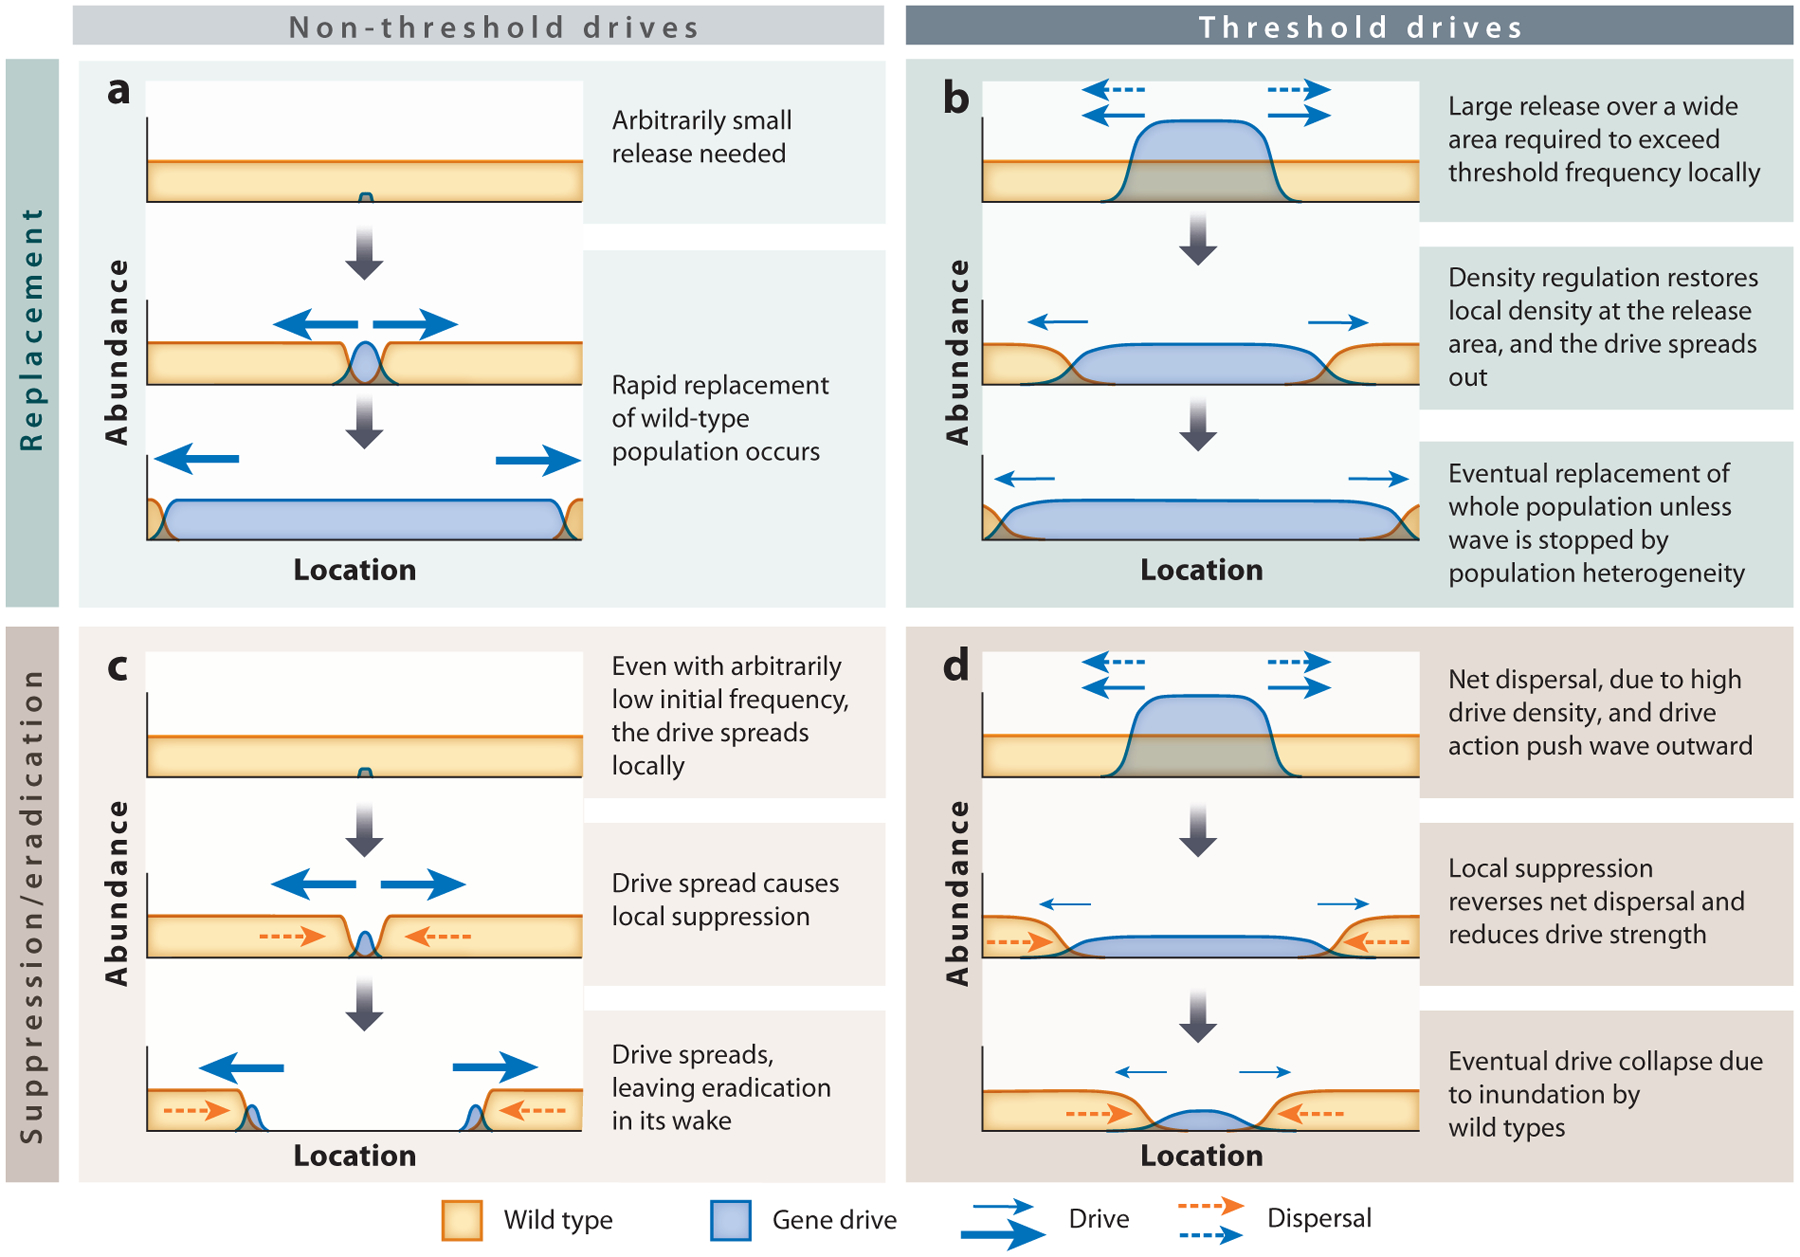
Figure 4.

The dynamics of replacement (top row) and suppression or eradication (bottom row) are shown for non-threshold (left column) and threshold (right column) drives. Within each panel, gray downward arrows indicate the progression of time. Horizontal arrows show the direction and relative strengths (indicated by arrow size) of factors that favor, in particular contexts, the spread of the gene drive (blue arrows) or of the wild-type alleles (orange arrows).
