Figure 2.

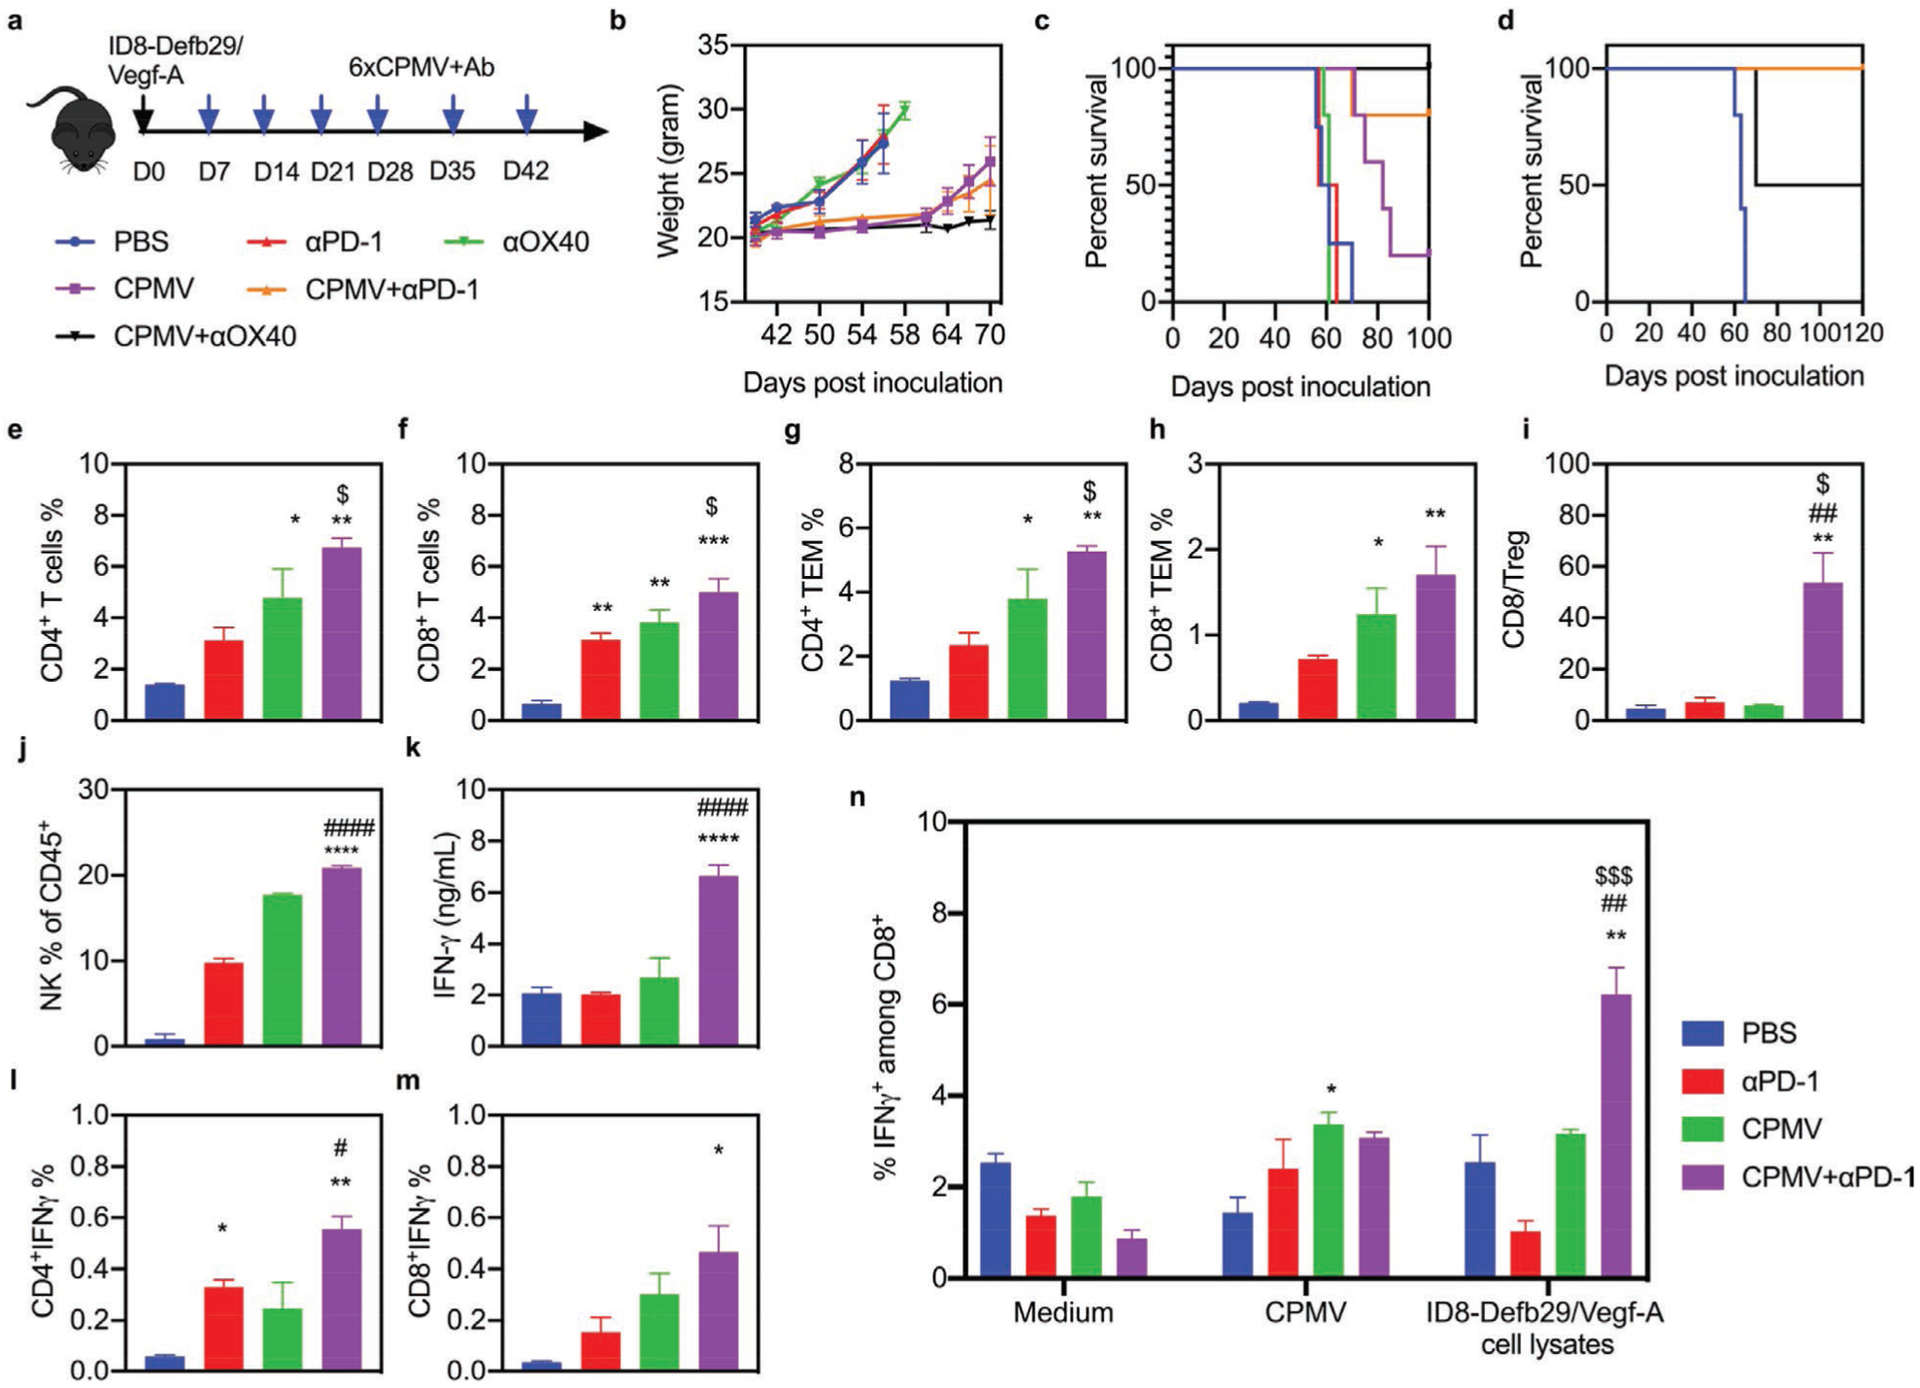
Combined CPMV and PD-1 inhibitor treatment synergistically enhances immunotherapeutic efficacy in a model of ovarian cancer. a) Schematic of the treatment strategy and dosing regimen. C57BL/6 mice were inoculated (i.p.) with 2 × 10⁶ ID8-Defb29/Vegf-A cells followed by six weekly injections (i.p.) of 50 μg antibody (PD-1 antagonist or OX40 agonist), 100 μg CPMV, the combination, or PBS as a control (n = 5). b) Body weight was measured to monitor tumor growth. c) Survival curves of the treatment groups. d) Survival curves of the combination therapy groups following tumor re-challenge at 100 dpi. e–n) C57BL/6 mice were inoculated (i.p.) with 2 × 10⁶ ID8-Defb29/Vegf-A-luc cells followed by two i.p. doses (21 and 28 dpi) of the PD-1 inhibitor antibody (100 μg), CPMV (100 μg), or the combination, and spleens and peritoneal wash/ascites were collected 2 days after the second dose. e–j) Percentages of CD4+ and CD8+ infiltrated T cells (and their subsets) and NK cells among CD45+ cells determined by flow cytometry. k) IFNγ levels in the supernatant of peritoneal wash/ascites. l–m) Percentages of total CD4+ and CD8+ infiltrated T cells staining positive for IFNγ. n) Splenocytes were cultured in fresh medium, CPMV suspensions, or ID8-Defb29/Vegf-A cell lysates for 24 h. Percentage of intracellular IFNγ was measured in CD8+ T cells by flow cytometry. Data are means ± SEM (n = 3). Statistical significance was calculated by one-way ANOVA: * versus PBS; # versus CPMV monotherapy; $ versus antibody monotherapy (*p < 0.05; **p < 0.01; ***p < 0.0005; ****p < 0.0001).
