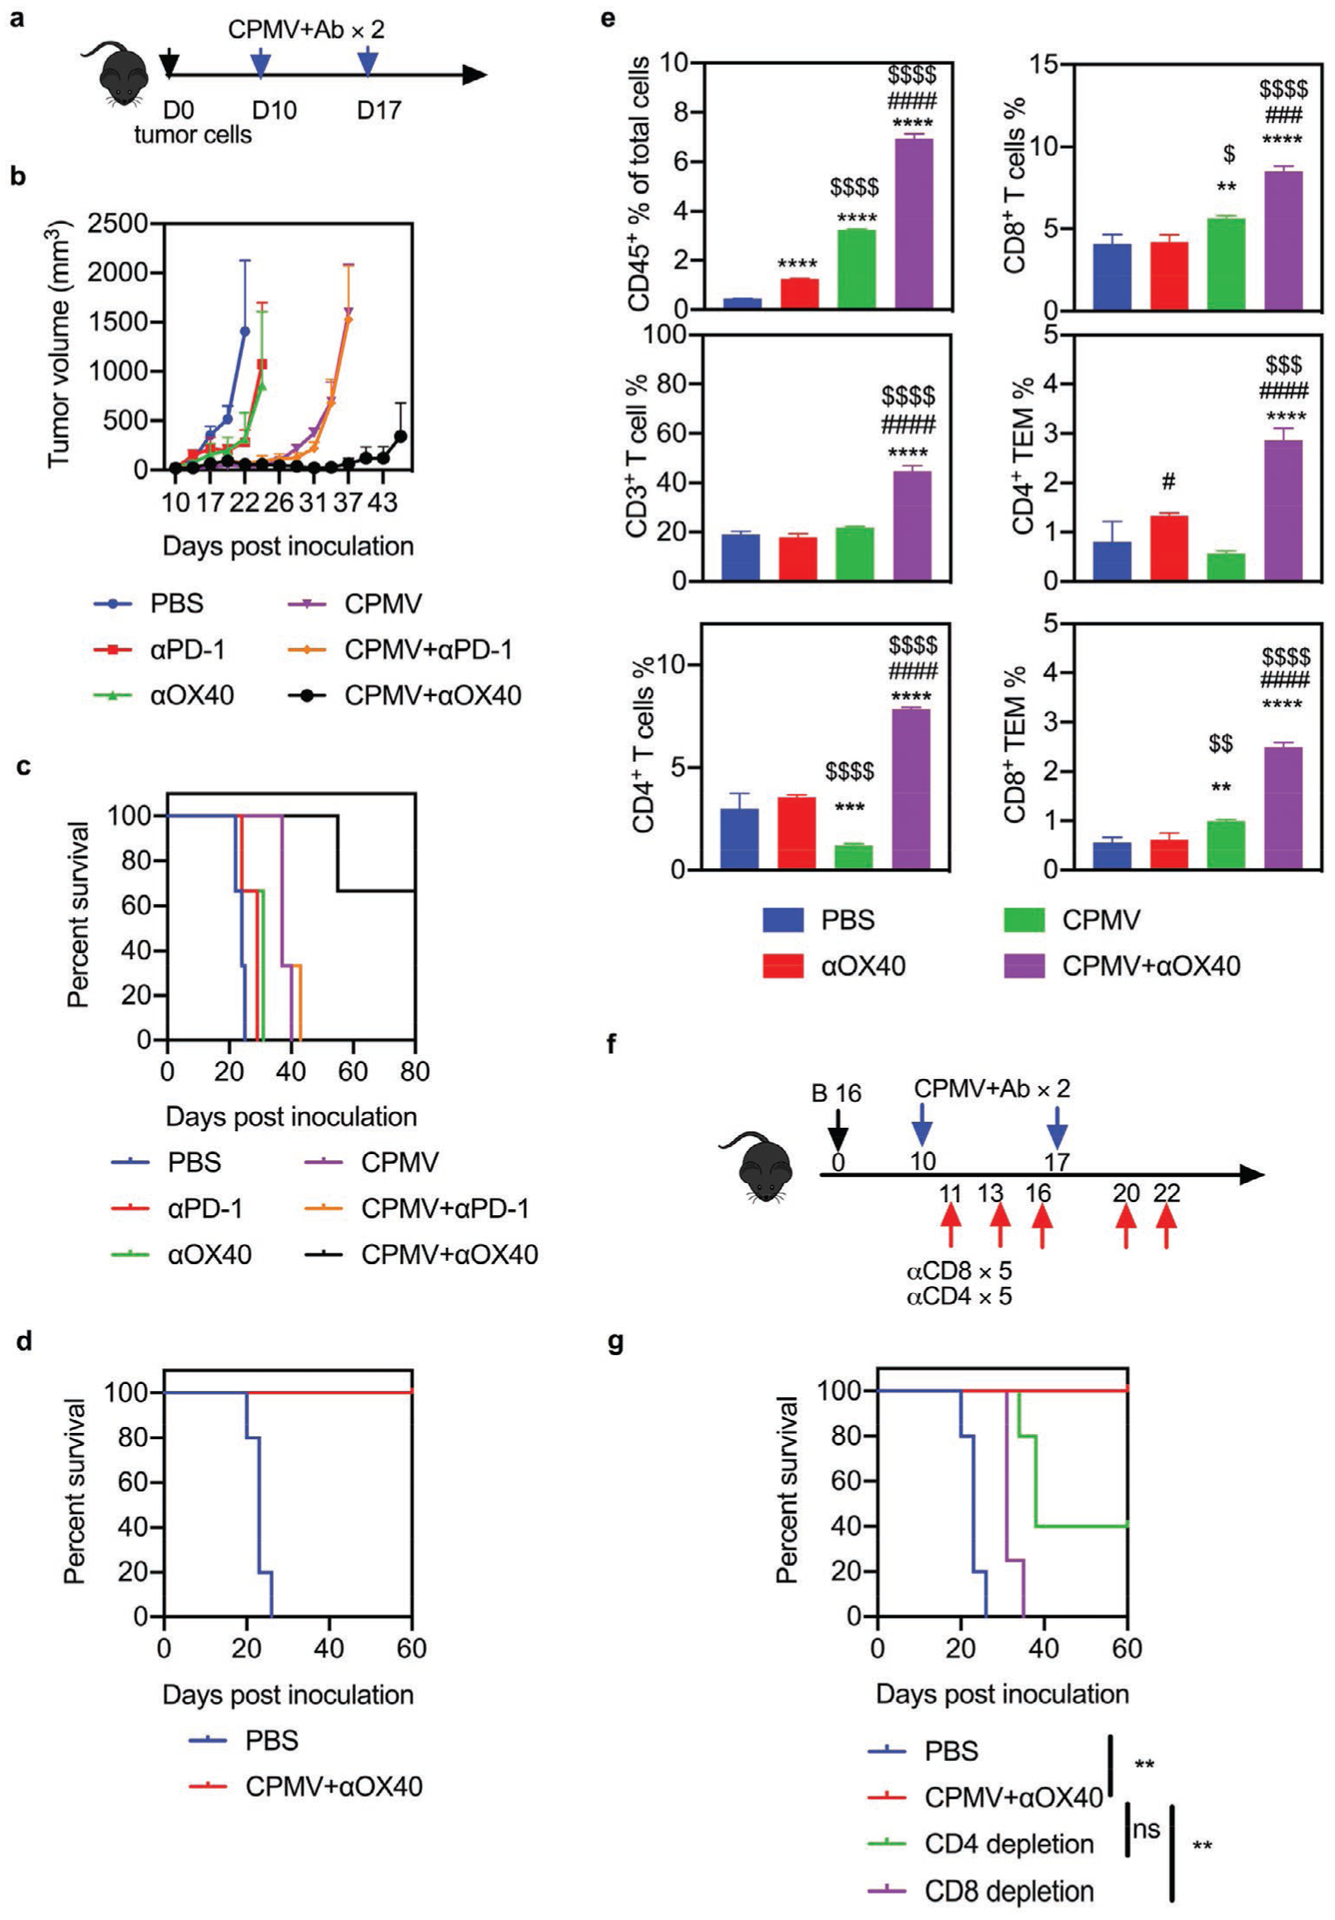
Figure 4.

Combined CPMV and OX40 agonist treatment induces systemic antitumor effects in a B16F10 dermal melanoma model. a) Schematic of treatment strategy and dosing regimen. C57BL/6 mice were inoculated intradermally (i.d.) with 2.5 × 10⁵ B16F10 cells on the right flank and followed by two doses (directly into the resulting tumor) of 100 μg antibody (PD-1 antagonist or OX40 agonist), 100 μg CPMV, the combination, or PBS as a control. b) Average tumor growth curve of mice receiving PBS (blue), PD-1 inhibitor (100 μg, red), OX40 agonist (100 μg, green), CPMV (100 μg, purple), CPMV+PD-1 inhibitor (orange), or CPMV+OX40 agonist (black). Data are means ± SEM (n = 3). c) Survival rate of each treatment group. d) Survival curves of combination therapy groups following tumor re-challenge. Data are means ± SEM (n = 5 for control, n = 2 for CPMV+OX40 agonist). e) Percentage of CD45+ leukocytes among total cells, the percentages of CD3+, CD4+, and CD8+ T cells among CD45+ cells, and the percentage of CD44+CD62L− effector memory T cells among CD45+ cells. Data are means ± SEM (n = 3). Statistical significance was calculated by one-way ANOVA: * versus PBS; # versus CPMV; $ versus ICT (*p < 0.05; **p < 0.01; ***p < 0.0005; ****p < 0.0001). f) Schematic of the T cell depletion strategy using a B16 dermal melanoma tumor model. g) Survival rate of each treatment group in the T cell depletion study. Data are means ± SEM (n = 4–5). Statistical significance was calculated using a log-rank Mantel–Cox test. **p < 0.01. ns: no significant difference.
