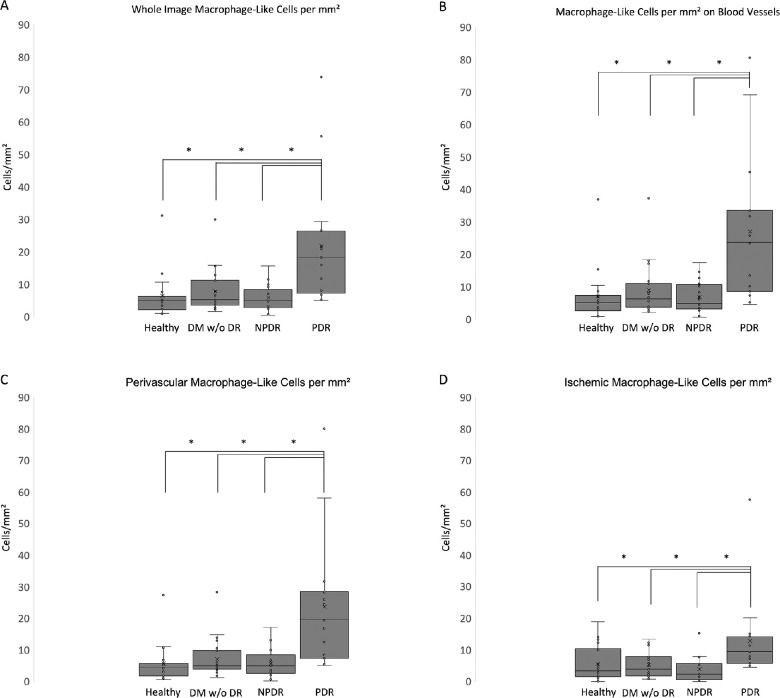
Figure 5.
MLC density was significantly increased in PDR, most prominently in the perivascular region. Box-and-whisker plots with asterisks indicating statistically significant (P < 0.05) differences show an increase in MLC density in PDR compared with healthy controls, DM without DR), and NPDR. No other comparisons among groups were significant for MLC density.

