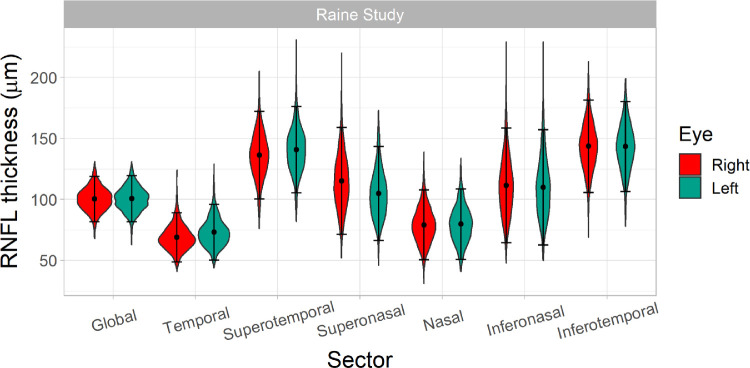
Figure 2.
Violin plots showing distributions of peripapillary RNFL thickness in the global and in each of the six RNFL sectors in the right and left eyes of Generation 2 Raine Study participants, separately. Right eye data are shown in blue and left eye data in red. The points represent the mean RNFL thicknesses and error bars represent ±1.96 standard deviations from the mean.

