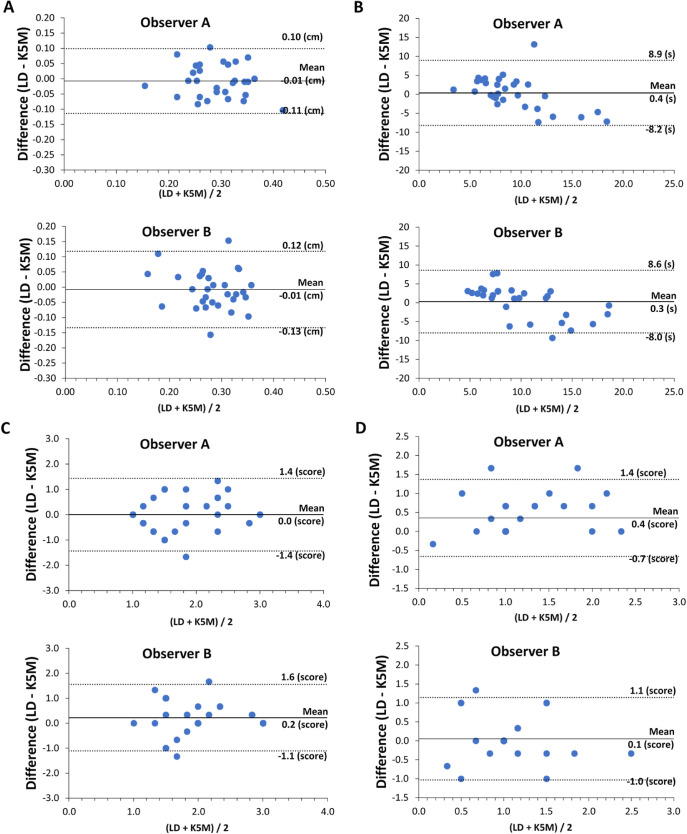
Figure 3.
The 95% limit of agreement between the LacryDiag and Keratograph. Bland Altman plots showing that the limits of agreement are similar between both observer A and observer B. (A) Tear meniscus height; (B) NIBUT; (C) interferometry; and (D) meiboscore. The 95% confidence intervals are shown as dotted lines. LD, LacryDiag; KG, Keratograph.

