
FIGURE 2.
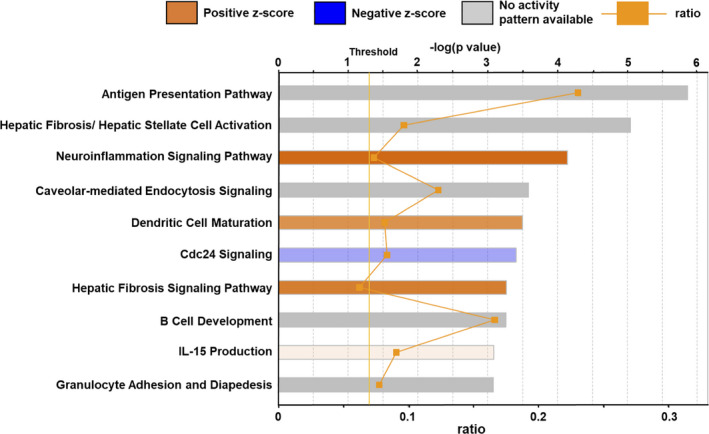
Top 10 biological pathways of Ingenuity Pathway Analysis. The significance score (negative log of the P‐value calculated using Fisher's exact test) for each pathway is indicated by the bars. The orange points on each pathway bar represent the ratio of the number of genes in a given pathway that meet the cutoff criteria (P < 0.05) and the total number of genes that map to the pathway. An orange bar predicts an overall increase in the activity of the pathway. A blue bar predicts an overall decrease in the activity. A gray bar predicts no activity pattern.