FIGURE 3.

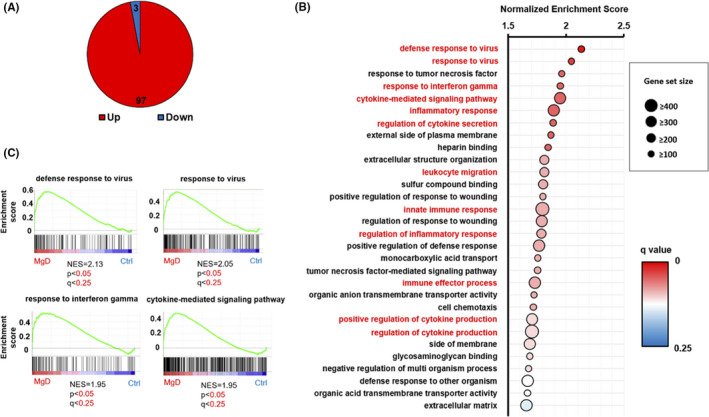
Gene Set Enrichment Analysis (GSEA) demonstrating the upregulation of immune/inflammation‐associated gene sets in the hippocampus of Mg2+ deficiency (MgD) mice. (A) GSEA revealed that the expression levels of 97 and 3 gene sets were significantly increased or decreased, respectively, in the hippocampus of MgD mice (n = 3) compared to control (Ctrl) mice (n = 4) (P < 0.05 and FDR < 0.25, gene set size ≥ 100). (B) Twelve immune/inflammation‐associated gene sets (in red) were observed in the top 30 gene sets showing upregulation of mRNA expressions in MgD mice. Normalized enrichment score (NES) for each gene set is indicated. (C) Representative enrichment plot showing significantly increased expression of inflammation‐associated gene sets in the hippocampus of MgD mice. Genes included in the enrichment score are shown in Table S4.
