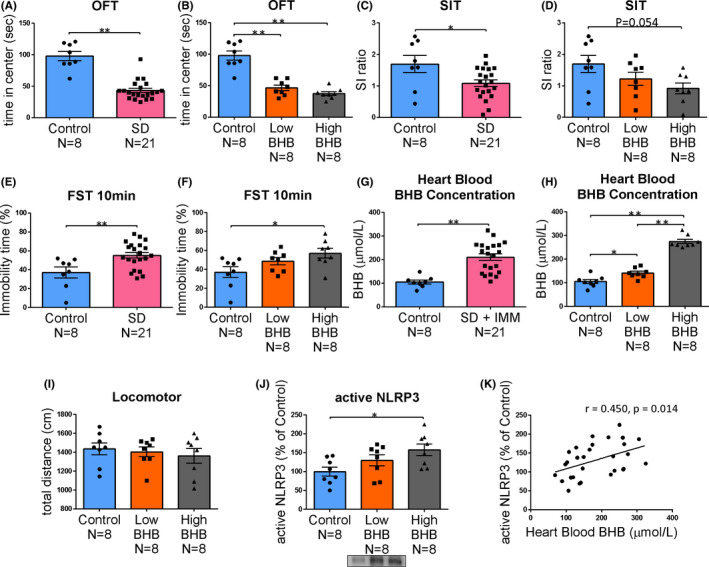
FIGURE 4.

Behavioral test results after social defeat stress, blood BHB levels, and prefrontal cortex NLRP3 activity. After 10 days of social defeat stress, various behavioral tests were conducted. A and B, Time in the center zone in the open field test (OFT); C and D: Social interaction (SI) ratio in the social interaction test (SIT). E and F, Immobility time at 10 min in the forced swim test (FST). G and H, BHB levels in heart blood (precise measurement) after 1 h of IMM stress (SD group only). I, Locomotor activity measured in the SIT. J: Active NLRP3 levels after 1 h of IMM stress (SD group only). K, BHB levels in the heart blood and the active NLRP3 levels in the prefrontal cortex were moderately correlated. Error bars represent the standard error of the mean (SEM). * P < 0.05 and ** P < 0.01
