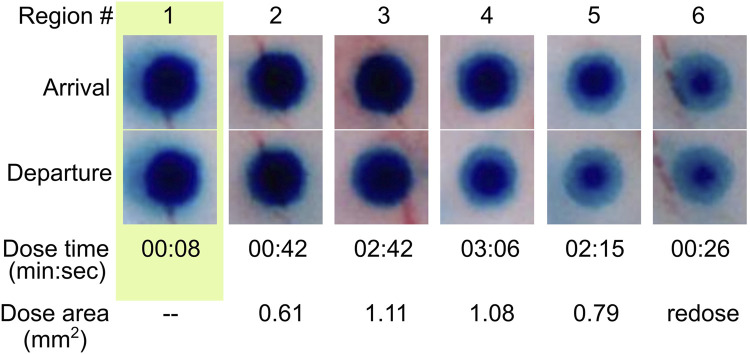
FIGURE 8.
Time lapse release of BG dye from MANiAC. BG distribution in MANiACs before and after dosing six regions (labeled in top row). Optical images of MANiACs upon arrival at and departure from target regions 1–6. Shown is a MANiAC sitting on top of tissue releasing the BG at the six different dose sites, with a decreasing circumferential intensity as the BG is released from the perimeter of the capsule. The arrival row shows the MANiAC's color upon arriving at the dose site, and the departure row shows MANiAC's color just before the MANiAC leaves the dose site. Due to burst effect dynamics, the core of the MANiAC maintains high concentrations of BG after several doses and several minutes of BG release. BG depletion from the periphery of the MANiAC is optically evident by dose number 4. Time is in units of min:sec. Dose area is given as square millimeters.

