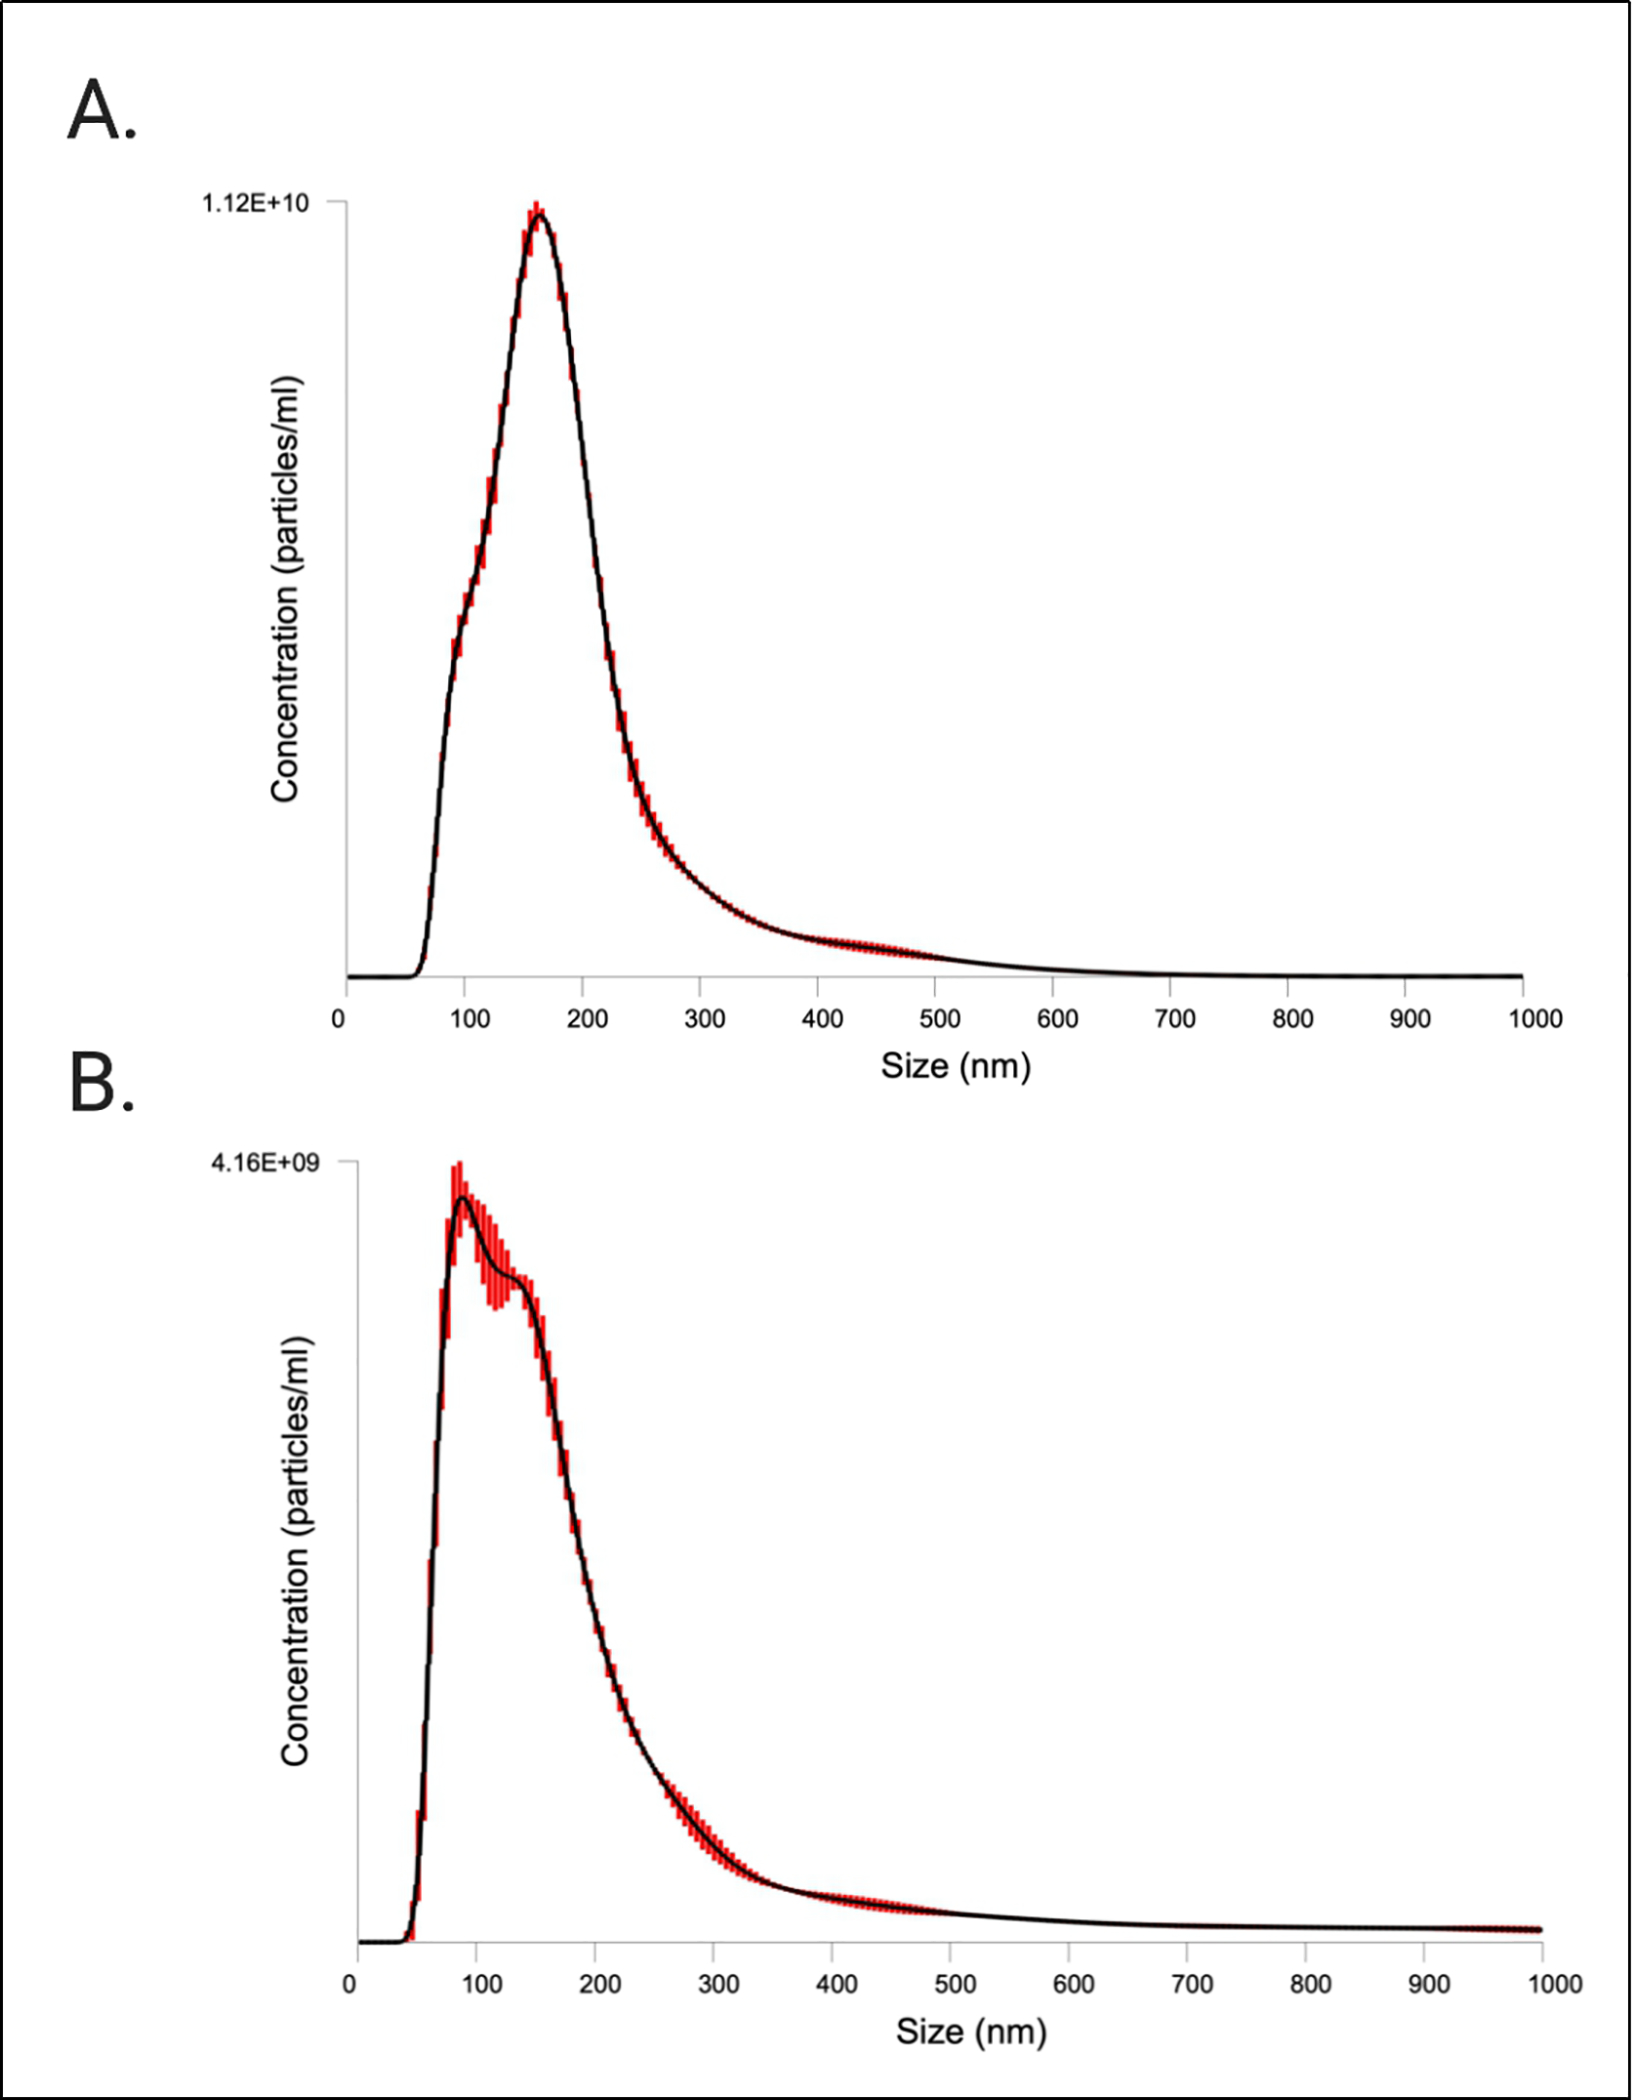
Figure 4.

Characterization of CFS EVs by NTA. PSDs from NTA FTLA data on the NanoSight LM10 are shown. Red bars indicate ± standard error of the mean. The PSDs are the average size/concentration of three technical replicates. Graphs are representative of measuring samples using the optimal particle/frame rate according to the operating manual for NanoSight LM10. (A) NTA in light scatter mode (conventional NTA); (B) NTA in fluorescent mode (fNTA). CFS: Cell-free saliva; EVs: extracellular vesicles; NTA: nanoparticle tracking analysis; PSD: particle size distribution; FTLA: finite track length adjustment.
