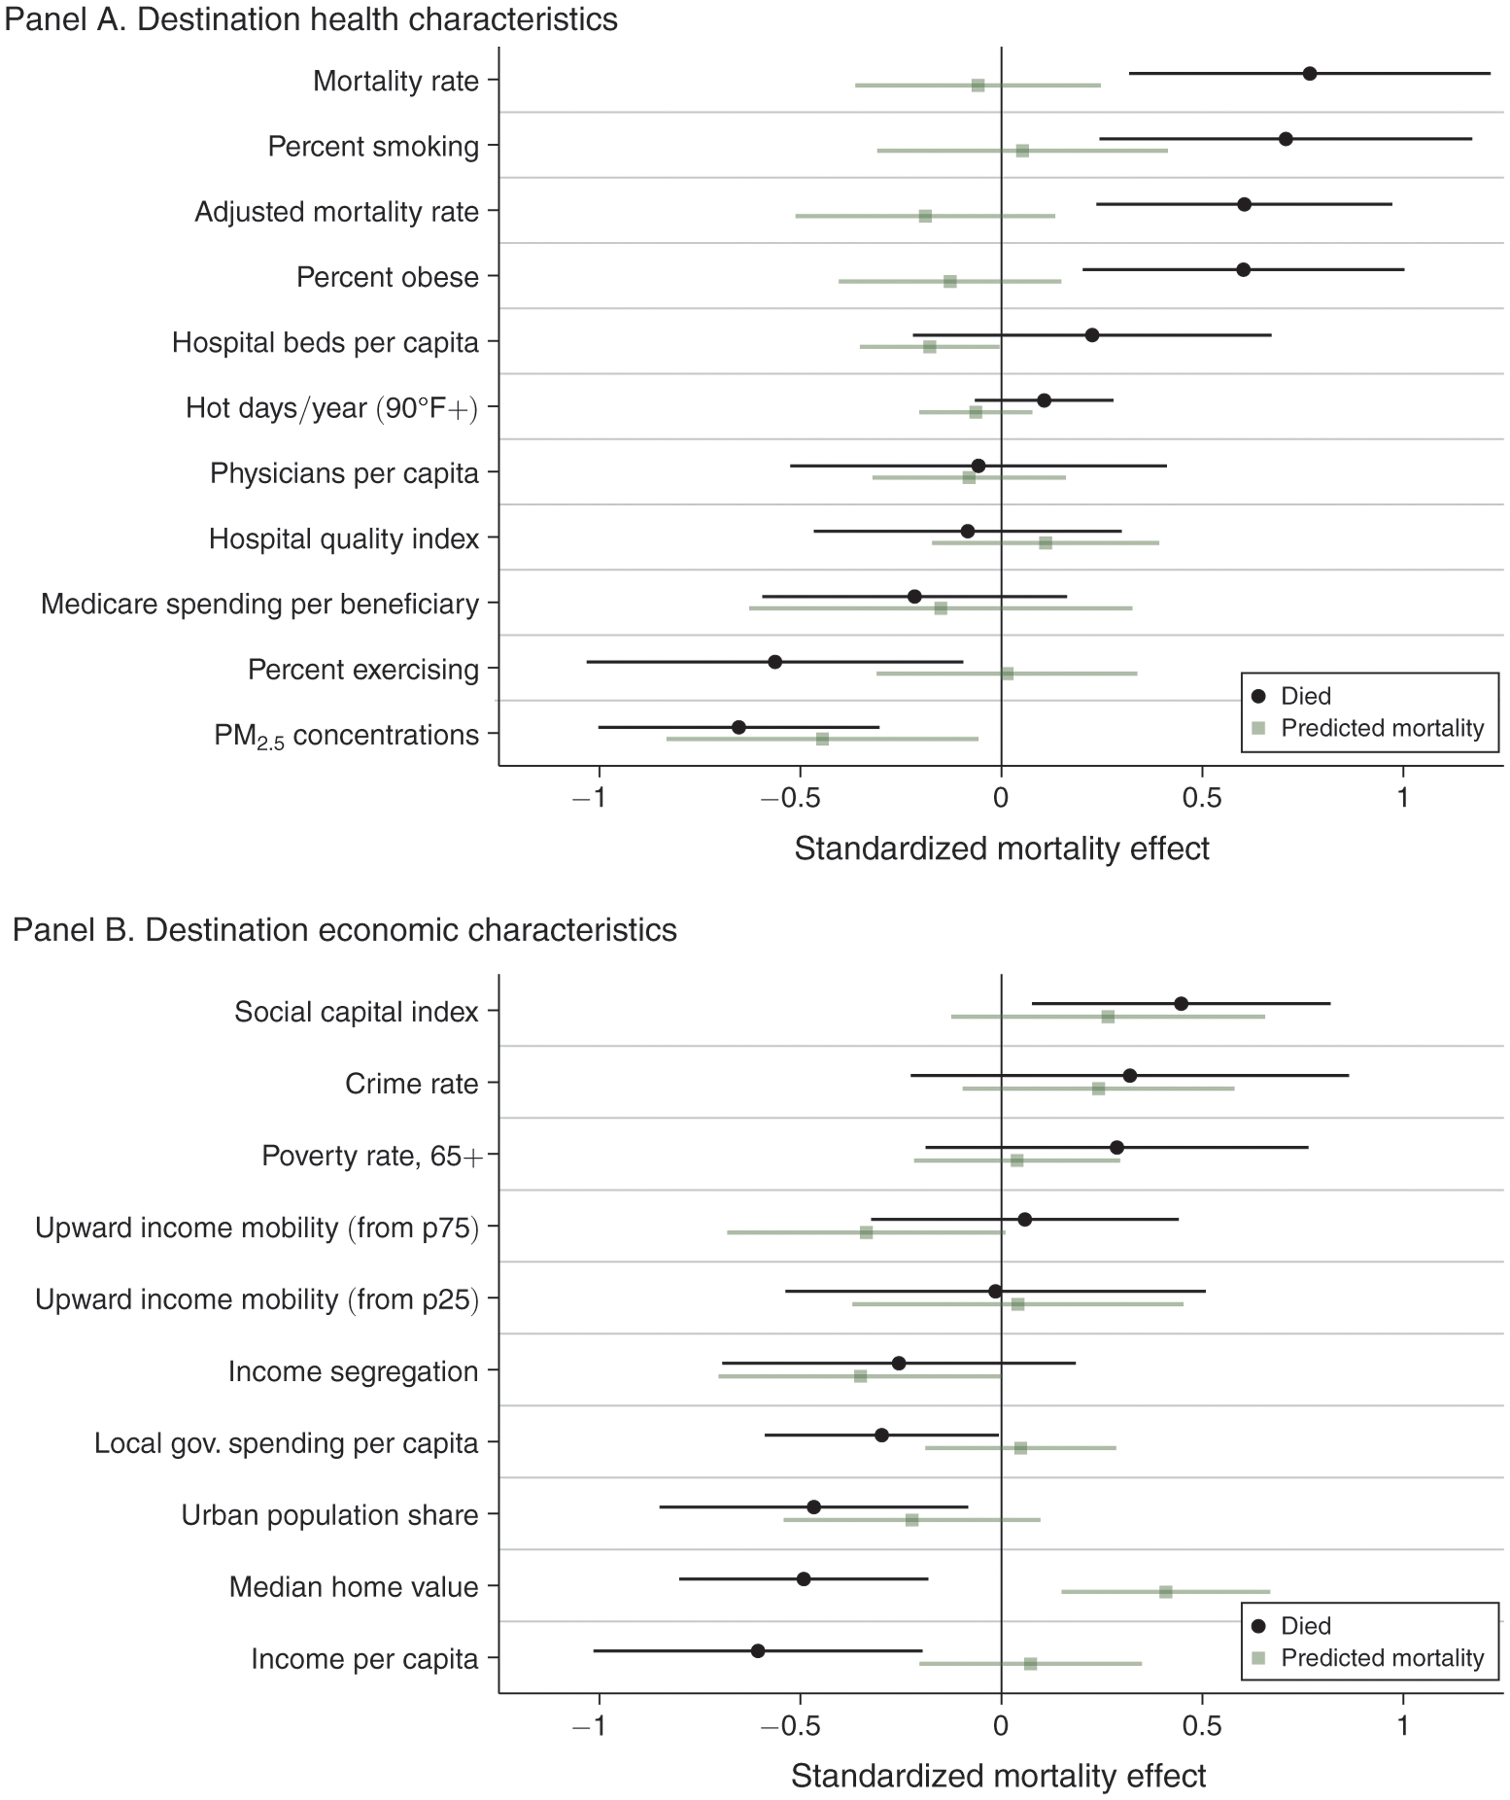
Figure 6.

Mover Mortality by Destination Characteristic
Notes: The figure shows estimates and 95 percent confidence intervals of how realized and ex ante predicted mortality rates of movers relate to the local characteristics of the counties to which they moved. The standardized mortality effect reflects the effect of an interdecile range change in the local characteristic reported in the row, based on the tenth and ninetieth percentiles of the local characteristic exposure among movers. Numerical values of the point estimates and standard errors for the Died and Predicted mortality outcomes are reported in columns 1 and 4, respectively, of online Appendix Tables A.18 and A.19. Online Appendix Table A.17 reports summary statistics for each of the destination characteristics. See notes to online Appendix Table A.18 for additional details about the sample and controls.
