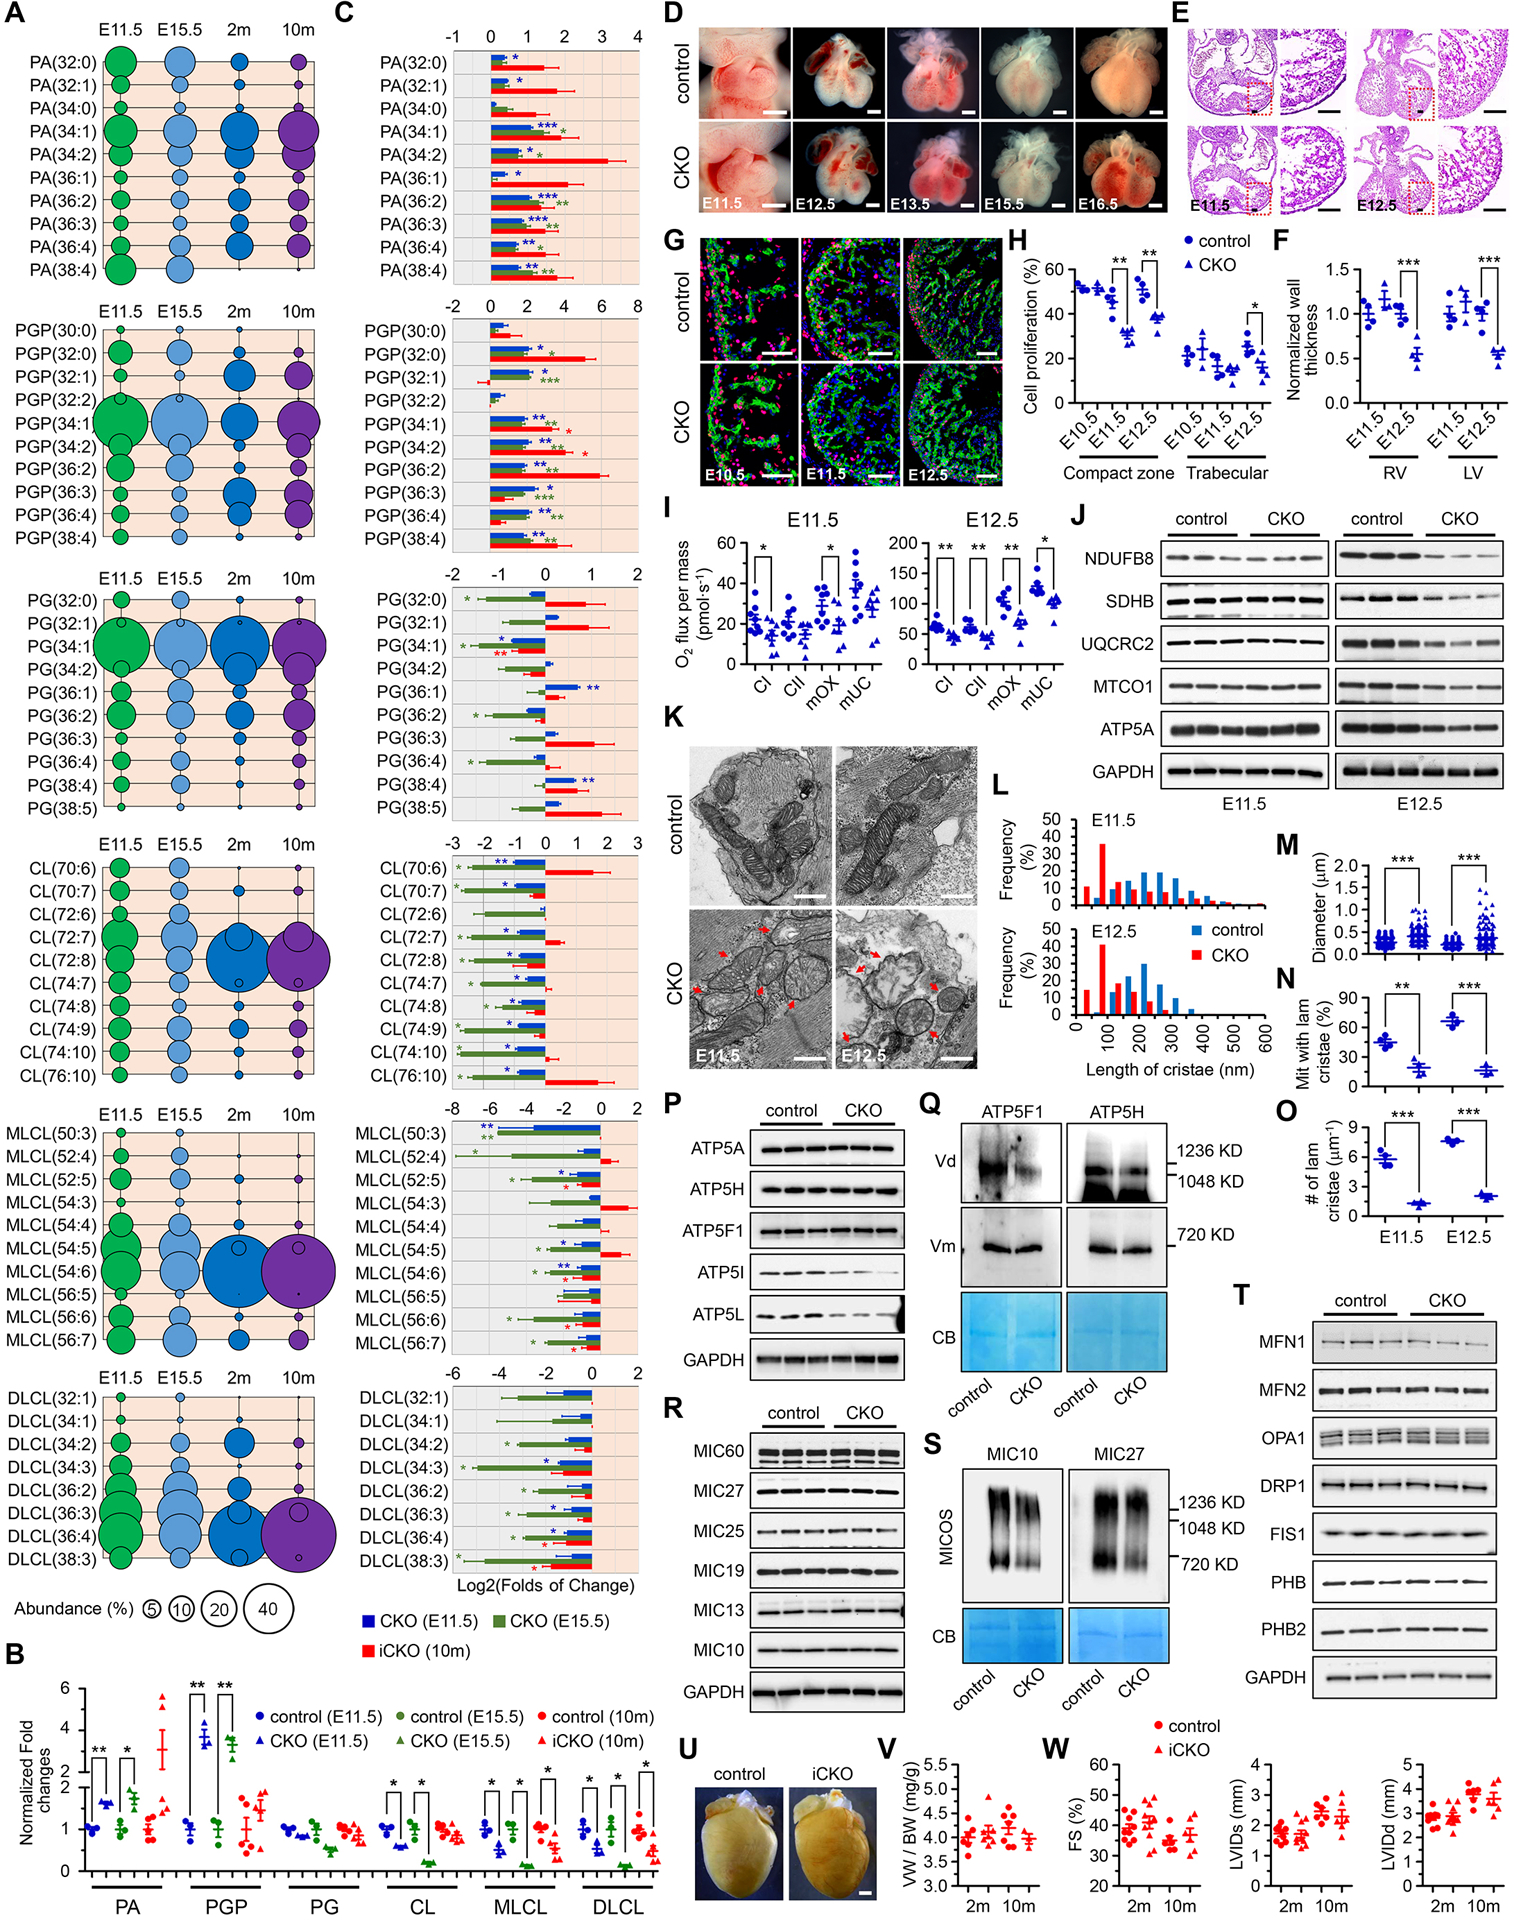
Figure 1. PTPMT1 is required for embryonic cardiac cardiolipin biosynthesis to regulate mitochondrial morphogenesis and heart development.

(A) Quantitative lipidomic analysis was applied to identify individual species of cardiolipin and cardiolipin-related metabolites, including phosphatidic acid (PA), phosphatidylglycerophosphate (PGP), phosphatidylglycerol (PG), cardiolipin (CL), monolyso-CL (MLCL), and dilyso-CL (DLCL) in the ventricles of control mice at embryonic day 11.5 (E11.5), E15.5, 2 months (2m), and 10m of age, respectively. The 10 most abundant species, if more than 10 species were observed, or all the species of each metabolite, were selected and further analyzed at each stage. The abundance (%) of individual species was calculated according to its total level and was represented by the area of the circle. n = 3, 3, 6, and 6, respectively. (B) The levels of total PA, PGP, PG, CL, MLCL, and DLCL in TnT-Cre-mediated PTPMT1 knockout ventricles (CKO) at E11.5 (n = 3) and E15.5 (n = 3), and in αMHC-CreER-mediated PTPMT1 knockout (iCKO) ventricles 10 months post Tamoxifen-induced gene deletion (n = 5) were analyzed and normalized to their control ventricles (n = 3, 3, and 5, respectively), respectively. Twenty-five and six ventricles with the same genotype were pooled as one sample at E11.5 and E15.5, respectively. (C) The levels of the 10 most abundant species if more than 10 species were observed, or the levels of every species of PA, PGP, PG, CL, MLCL, and DLCL in CKO and iCKO ventricles were further analyzed and normalized to their control ventricles, respectively. (D-H) Representative images of embryonic hearts (D), sections stained with hematoxylin and eosin (E), and images of EdU labeling (G) of control and CKO mice at indicated stages. Cardiac cells were co-stained with α-Actinin. Scale bar = 0.5mm, 100μm, and 50μm respectively. The thickness of left and right ventricular walls (F) of control (n = 4 at both stages) and CKO (n = 3 and 4, respectively) hearts, and the ratios of EdU-positive cardiomyocytes in ventricular compaction zone and trabecular (H) of control (n = 3, 4, and 4, respectively) and CKO (n = 3, 5, and 5, respectively) hearts were measured at indicated stages. (I) Oxygen (O2) flux representing the respiratory function of complex I (CI) and complex II (CII), the maximum OXPHOS capacity (mOX), and the maximum uncoupled capacity (mUC) were measured in control and CKO hearts by high-resolution respirometry at E11.5 and E12.5, respectively. The measurement was performed on two hearts with the same phenotype at E11.5 or one heart at E12.5 in one chamber. n = 8 per group at E11.5; n = 6 per group at E12.5. (J) Immunoblot analysis on the expression of mitochondrial OXPHOS subunits including NDUFB8 (complex I), SDHB (complex II), UQCRC2 (complex III), MTCO1 (complex IV), and ATP5A (complex V) in control and CKO embryonic hearts at E11.5 and E12.5. GAPDH was used as the loading control. (K) Representative transmission electron microscopic images of mitochondria in control and CKO cardiomyocytes at E11.5 and E12.5. Red arrows indicate the mitochondria with bubble-like cristae in CKO cardiomyocytes. Scale bar, 0.5μm. (L-O) Quantitative analysis of length of cristae (L), mitochondrial diameter in the short axis (M), the percentage of mitochondria with lamellar cristae (N), and the number of lamellar cristae along the mitochondrial long axis (O) in control and CKO cardiomyocytes at E11.5 (n = 4 per group) and E12.5 (n = 3 per group). At least 160 mitochondria were measured for each embryonic heart. (P-T) Immunoblot analysis of F1F0-ATP synthase subunits (P) including ATP5A (F1 complex subunit α), ATP5H (F0 complex subunit d), ATP5F1 (F0 complex subunit b), ATP5I (F0 complex subunit e), and ATP5L (F0 complex subunit g), MICOS complex subunits (R) including MIC60, MIC27, MIC25, MIC19, MIC13, and MIC10, as well as mitochondrial dynamics-related proteins (T) including MFN1, MFN2, OPA1, DRP1, and FIS1 and prohibitin proteins including PHB and PHB2 at E11.5. GAPDH was used as the loading control. Blue native-PAGE and immunoblot analysis of F1F0-ATP synthase complex using the antibodies against ATP5F1 and ATP5H (Q), and MICOS complex assembly using the antibodies against MIC10 and MIC27 (S). To note, the deletion of PTPMT1 reduced the formation of F1F0-ATP synthase dimers (Vd) whereas monomers (Vm) were not affected. The reduction of the MICOS complex assembly in CKO mitochondria was also observed. Each mitochondrial sample was prepared from over 50 embryonic ventricular tissues of the same genotype in 1% digitonin-containing extraction buffer, and separated by blue native-PAGE. Coomassie blue (CB) stained membranes were scanned for loading control. (U) Representative hearts of control and iCKO mice at 10 months post tamoxifen injection. Scale bar, 1mm. (V) Ratios of ventricle weight (VW) to body weight (BW) in control and iCKO mice at 2m and 10m post tamoxifen injection. n = 3–7 mice per group. (W) Echocardiographic assessment in control and iCKO mice at 2m and 10m post tamoxifen injection. n = 6–10 mice per group. All data represent mean ± SEM. Significance was determined by two-tailed, unpaired Student’s t test. *p < 0.05, **p < 0.01, ***p < 0.001 versus control.
